Autor Cointelegraph By Jordan Finneseth

Altcoin Roundup: DeFi token prices are down, but utility is on the rise

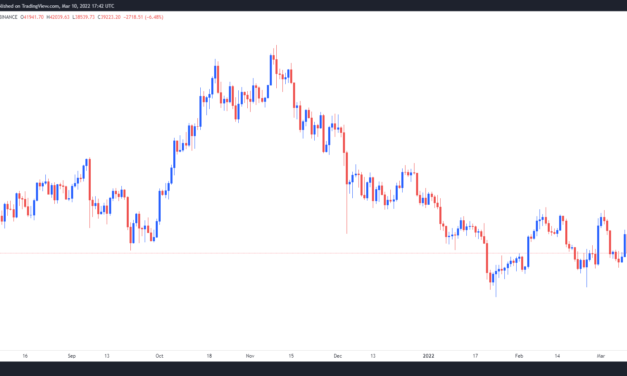
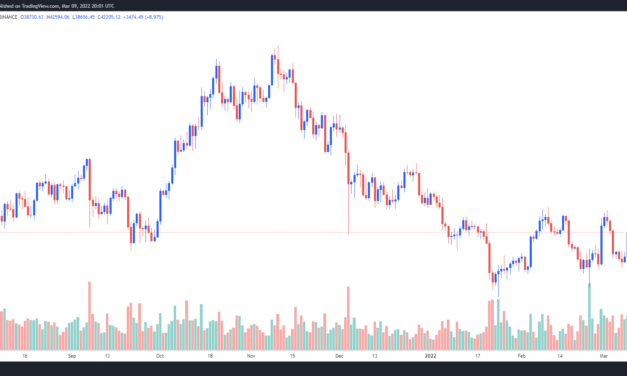
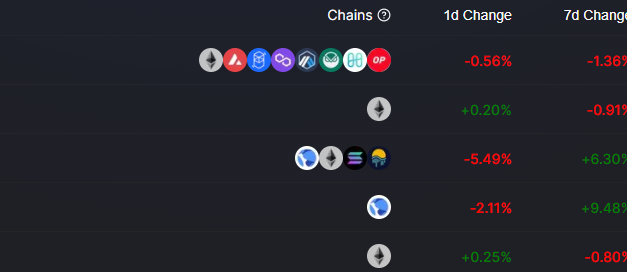
The decentralized finance (DeFi) sector has been sitting in the backseat since whipping up a frenzy in the summer of 2020 through the first quarter of 2021. Currently, investors are debating whether the crypto sector is in a bull or bear market, meaning, it’s a good time to check in on the state of DeFi and identify which protocols might be setting new trends.Here’s a look at the top-ranking DeFi protocols and a review of the strategies used by users of these protocols. Stablecoins are the foundation of DeFi Stablecoin-related DeFi protocols are the cornerstone of the DeFi ecosystem and Curve is till the go-to protocol when it comes to staking stalbecoins. Top 5 protocols by total value locked. Source: Defi LlamaData from Defi Llama shows four out of the top five protocols in terms of total value locked (TVL) are connected to the creation and management of stablecoins.It’s important to note that while these protocols have emerged on top when it comes to TVL, the value of their native tokens for the most part are significantly down from their 2021 all-time highs.The main takeaway is that engaging with the stablecoin aspect of the DeFi market through staking and farming has offered steady yields while also earning the governance tokens for these platforms as an added bonus to help mitigate the drop in token values. As it stands now, stablecoins play an integral role in the overall healthy functioning of DeFi which continues to expand as newer protocols like Frax Share and Neutrino climb the TVL ranks amidst the increasing number of interconnected blockchain networks. Lending and borrowing is at the core of DeFi’s value propositionLending platforms are another key component of the DeFi ecosystem and one of the key features that investors can interact with even during a bear market. AAVE and Compound are the current leaders with respective TVLs at $12.09 billion and $6.65 billion. Like other stablecoin protocols, AAVE and Compound saw the value of their native tokens peak in 2021 and both have been in a prolonged downturn for months. AAVE/USDT vs. COMP/USDT 1-day chart. Source: TradingViewAAVE’s TVL growth outpaced Compound largely due to its cross-chain integration of Polygon and Avalanche, which increased the number of supported assets and allowed users to avoid the high gas fees on the Ethereum network.Long-term crypto hodlers who are risk averse can benefit from simply lending their tokens for a modest yield. Aave vs. Compound stablecoin yields. Source: DeFi PrimeRelated: Altcoin Roundup: JunoSwap, Solidly and VVS Finance give DeFi a much-needed refreshLiquid staking adds more utility to DeFiThe growing popularity of liquid staking is also adding new utility to decentralized finance. Liquid staking protocols like Lido Finance, which originally launched as an Ethereum staking solution but has since expanded support to Terra (LUNA), Solana (SOL), Kusama (KSM) and Polygon (MATIC). Data from Defi Llama shows the TVL on Lido reaching a new all-time high of $14.96 billion on March 10 as the addition of new assets continues to attract more value to the protocol. Total value locked on Lido. Source: DeFi Llama.On Lido, users can stake Ether and Solana and receive stETH or stSOL, which can then be used as collateral on AAVE to borrow stablecoins. Those assets can then be used for trading or yield farming purposes, thus increasing the overall yield earned from the original staked asset. Other notable liquid staking protocols include the Eth2 staking provider StakeWise, the Cosmos-based pStake protocol and Stader Labs. Want more information about trading and investing in crypto markets?The views and opinions expressed here are solely those of the author and do not necessarily reflect the views of Cointelegraph.com. Every investment and trading move involves risk, you should conduct your own research when making a decision.

Čítaj viac

$40K Bitcoin price is in reach, but analysts warn that a sweep of recent lows is likely

There’s was no rest for weary crypto traders on March 10 as a blistering 7.9% CPI print emerged as the headline of the day, putting pressure on global financial markets and erasing the previous day’s gains in Bitcoin (BTC) as the price fell back below $40,000. Data from Cointelegraph Markets Pro and TradingView shows that the BTC sell-off kicked off in the early trading hours on Thursday and escalated into midday with the price hitting a low of $38,562 before dip buyers bid it back above support at $39,000. BTC/USDT 1-day chart. Source: TradingViewHere’s what analysts have to say about the ongoing see-saw price action for BTC and what levels to keep an eye on for a bullish breakout or bearish downturn. “Price compression precedes volatility”Insight into the recent volatility for Bitcoin was offered by crypto trader and pseudonymous Twitter user ‘Rekt Capital’, who posted the following chart noting that “BTC is still consolidating between the green higher low support and the blue 50-week EMA resistance.”BTC/USD 1-week chart. Source: TwitterAccording to Rekt Capital, “the higher lows and lower highs are compressing price. Price compression precedes volatility.”As for what it would take to reclaim the bullish narrative, Rekt Capital pointed to the green and blue exponential moving average (EMA) lines which have proved to be strong points of resistance over the past two weeks. Rekt Captial said, “To move higher inside its macro range, BTC needs to reclaim the two key bull market EMAs to confirm bullish momentum.”BTC holders risk selling at a lossThe oscillating nature of BTC’s price action in recent weeks was discussed by research fund, Stack Funds, which noted in its current weekly report that “Bitcoin has whipsawed the past few weeks, trading within the $35,000 – $45,000 range with no strong directional momentum intact.” According to Stack Funds, this recent price action “has been mainly news-driven” and the analysts see no relief in the near term as the conflict in Ukraine and the persistent rise of inflation continue to pose significant headwinds. Evidence that traders have a low appetite for increasing exposure to the current market conditions can be found by looking at the Bitcoin Spent Output Profit Ratio (SOPR), a metric that indicates the aggregate gains and losses realized on a particular day.Stack Funds noted that the long-term BTC holder SOPR “is trending towards its threshold value of 1.0,” an important level as it marks the defining line between selling at a profit or selling at a loss. Bitcoin long-term holder SOPR. Source: Stack FundsAccording to the report, the long-term holder SOPR has been trending down since Bitcoin’s price hit its peak in November 2021,” and currently it trades “around the 1.5 handle.”During the two instances shown on the chart above where the SOPR trended and traded below the 1.0 threshold in mid-2018 and the end of 2019, “Bitcoin traded sideways and dipped further both times.”Stack Funds said, “Unless we see some positive catalyst in the markets or a reversal in the SOPR indicator, we expect sideways trading and possibly a potential dip in price action, at least in the short term.”But it’s not all doom and gloom when it comes to Bitcoin price from an on-chain analysis point of view. In the following chart posted by crypto analyst and pseudonymous Twitter user ‘Plan C’, the analyst explains that “the number of Bitcoin accumulation addresses has gone parabolic over the last month.”The number of unique BTC accumulation addresses. Source: TwitterPlan C defined accumulation addresses as “addresses that have at least 2 incoming non-dust transfers and have NEVER spent funds BTC.”Related: Bitcoin spoofs $40K breakout as US CPI inflation data conforms to 7.9% estimatesNot bullish below $46,000As for the near-term outlook for Bitcoin, market analyst and Cointelegraph contributor Michaël van de Poppe noted that things are not looking bullish below $46,000 and he thinks “the chances of taking these lows are quite significant.”BTC/USDT 1-day chart. Source: TwitterThese short-term bearish sentiments were echoed recently by David Lifchitz, managing partner and chief investment officer at ExoAlpha, who noted that the recent spike in BTC “came out of nowhere and lasted less than one hour with not much follow-through.” Lifchitz said, “BTC remains still stuck in the $33,000-$45,000 range. Without any follow-through in the next 48 hours and a possible break above $45,000 toward $50,000, BTC will probably keep on bouncing in the range.”The overall cryptocurrency market cap now stands at $1.744 trillion and Bitcoin’s dominance rate is 42.6%.The views and opinions expressed here are solely those of the author and do not necessarily reflect the views of Cointelegraph.com. Every investment and trading move involves risk, you should conduct your own research when making a decision.

Čítaj viac

Bitcoin rallied, but analysts say it’s ‘more of the same’ until $46K becomes support

“Volatility” is the word of the month and that is exactly what cryptocurrency investors saw today as Bitcoin rallied after concerns over the Biden administration’s executive order on crypto turned out to be a ‘nothingburger’.Data from Cointelegraph Markets Pro and TradingView shows that after trading near the $39,000 mark for the past few days, the price of Bitcoin (BTC) spiked 10.42% to an intraday high at $42,606 on as cautious traders flooded back into the market. BTC/USDT 1-day chart. Source: TradingViewHere’s a look at what traders and analysts in the market are saying about this latest move and the areas of support and resistance to keep an eye on. “Different pump, same story”Wednesday’s move for Bitcoin was just a repeat of recent behavior according to crypto analyst and pseudonymous Twitter user ‘Plan C’, who posted the following chart stating “Different pump, same story.”Upper and lower trend support bands for Bitcoin. Source: TwitterPlan C said, “BTC needs to break the “downtrend resistance band,” AKA Uptrend Support Band, and then hold it as support. Otherwise, this is just another cry wolf move. Uptrend Support Band: $43,564 – $46,265.”Independent market analyst ‘Crypto_Ed_NL’ agreed with this sentiment and suggestion further sideways trading in the post below.BTC/USD 4-hour chart. Source: TwitterCrypto_Ed_NL said, “No, this is not some new Elliott Wave theory… It’s what I think is coming next. Pump-range-pump-dump-range-dump-range-pump.”Overconfidence is not advised!Analysts at Delphi Digital noted that Bitcoin is now bumping up against the “simple trendline connecting the local highs from December 2021 and February 2022.”BTC/USD 12-hour chart. Source: Delphi DigitalAccording to Delphi Digital, now that BTC is back above $40,000, traders should “look for this level around $42,500-$43,000 to be tested,” which is exactly what occurred in trading on March 9. Delphi Digital said, “Contrarian sentiment analysis is often a good place to begin looking for trades much like the latest short-term rally in prices off of the $34,000 lows, but we caution the worsening macro and global backdrop is still a key consideration for market performance at this point in time.”Related: Price analysis 3/9: BTC, ETH, BNB, XRP, LUNA, SOL, ADA, AVAX, DOT, DOGEBitcoin needs to close above $43,100Independent market analyst ‘Rekt Capital’ posted the following chart highlighting that “BTC has performed upside wicks beyond the $43,100 resistance on a few occasions over the past few weeks (orange circle).”BTC/USD 1-week chart. Source: TwitterRekt Capital said, “Which is why it’s important that BTC performs a Weekly Close above this level, just like in the previous blue circle in August 2021.”The overall cryptocurrency market cap now stands at $1.839 trillion and Bitcoin’s dominance rate is 43.5%.The views and opinions expressed here are solely those of the author and do not necessarily reflect the views of Cointelegraph.com. Every investment and trading move involves risk, you should conduct your own research when making a decision.

Čítaj viac

Monero, Kyber Network and Tornado Cash break out as traders pile into privacy protocols

Stocks and cryptocurrencies saw a notable bounce on March 9 even though war, rising inflation and historically high oil prices have investors uncertain about the future.Bitcoin (BTC) price surged to $42,600 in the early trading hours and several altcoins followed suit with double-digit gains.Top 7 coins with the highest 24-hour price change. Source: Cointelegraph Markets ProData from Cointelegraph Markets Pro and TradingView shows that the biggest gainers over the past 24-hours were Monero (XMR), Kyber Network (KNC) and Tornado Cash (TORN), with Zcash (ZEC) earning an honorable mention. MoneroMonero is one of the longest-running privacy-focused protocols in the cryptocurrency market and the project is popular among investors looking to make private, anonymous transactions.Data from Cointelegraph Markets Pro and TradingView shows that the price of XMR rallied 36% from a low of $153 on March 7 to a daily high at $208.82 on March 9 as its 24-hour trading volume increased by 186%.XMR/USD 4-hour chart. Source: TradingViewThe surging price of Monero comes as an increase in global regulatory concerns and sanctions may have pushed crypto users toward privacy-focused protocols to prevent their assets from being seized or frozen. Kyber NetworkKyber Network extended the hot streak it has been on since early 2022 after the multi-chain decentralized exchange (DEX) and aggregation platform saw its price surge 37% from a low of $2.33 on March 7 to a daily high at $3.19 on March 8 as its 24-hour trading volume spiked 222%.VORTECS™ data from Cointelegraph Markets Pro began to detect a bullish outlook for KNC back on Jan. 22, prior to the recent price rise. VORTECS™ Score (green) vs. KNC price. Source: Cointelegraph Markets ProAs seen in the chart above, the VORTECS™ Score for KNC hit a high of 77 on Jan. 22, around 48 hours before the price began to climb 148.58% over the next six weeks. The momentum for KNC follows the release of Kyber 3.0 in late January and the protocol’s March 6 launch on Arbitrum, which promises to offer faster transaction times with lower fees. Related: Kyber Network (KNC) bucks the market-wide downtrend with a 57% gain in JanuaryTornado CashTornado cash is a decentralized, non-custodial protocol that provides private crypto transactions by breaking the on-chain link between source and destination addresses.VORTECS™ data from Cointelegraph Markets Pro began to detect a bullish outlook for TORN on March 8, prior to the recent price rise. VORTECS™ Score (green) vs. TORN price. Source: Cointelegraph Markets ProAs seen in the chart above, the VORTECS™ Score for TORN began to pick up on March 7 and hit a high of 87 on March 8, around one hour before the price increased 32.7% over the next day.The climbing price of TORN follows the release of the protocol’s new decentralized relayers network which helps maintain privacy during the withdrawal process on the platform. Those interested in becoming part of the relayers network are required to stake a minimum of 300 TORN. The overall cryptocurrency market cap now stands at $1.732 trillion and Bitcoin’s dominance rate is 42.4%.The views and opinions expressed here are solely those of the author and do not necessarily reflect the views of Cointelegraph.com. Every investment and trading move involves risk, you should conduct your own research when making a decision.

Čítaj viac

Neutrino, Vires Finance and Waves bag 100%+ gain after pivot toward interoperability

Ongoing developments on the global stage continue to cause havoc in traditional markets and in the cryptocurrency sector.Despite these headwinds, projects in the Waves ecosystem have managed to climb higher in both price and total value locked (TVL) as a renewed focus on interoperability with popular blockchain networks brought fresh momentum. Total value locked on the top 3 Waves protocols. Source: Defi LlamaHere’s a closer look at the top-performing assets in the Waves ecosystem that have managed to post positive gains despite negative macroeconomic factors that are pressuring cryptocurrencies.Neutrino​Neutrino is an algorithmic price-stable “assetization protocol” that creates stablecoins tied to real-world assets and cryptocurrencies. Neutrino USD (USDN) is the main stablecoin of the Waves ecosystem and it goes along with the Neutrino Token (NSBT), a recapitalization and governance token that also enables the creation of stablecoins.Data from Cointelegraph Markets Pro and CoinGecko shows that since hitting a low of $7.07 on Jan. 22, the price of NSBT has rocketed 300% to hit a daily high of $30.33 on March 9. NSBT/USD 3-hour chart. Source: CoinGeckoWhile NSBT price was climbing, the TVL on the protocol also surged from $379.77 million on Feb. 22 to its current value of $1.15 billion, according to data from Defi Llama. Vires FinanceVires Finance (VIRES) is a decentralized, non-custodial liquidity protocol on the Waves blockchain that uses common pool-based mechanics to create equally distributed interest.According to data from CoinGecko, activity for VIRES began to pick up on Jan. 18 when its price hit a low of $19.30 and proceeded to surge 460% to hit an all-time of $108.44 on Jan. 24 and has since entered a consolidation period with its price currently trading near the $85 mark. VIRES/USD 1-day chart. Source: CoinGeckoThe total value locked on the VIRES protocol has increased from a low of $115.84 million on Feb. 1 to an all-time high of $764.23 million on March 8, according to data from Defi Llama. Related: 3 reasons why Waves price gained 100%+ in the last weekWavesWAVES token has been the main driver of growth for the Waves ecosystem over the past six weeks, thanks in large part to the ongoing migration to Waves 2.0. The new blockchain will support advanced interoperability features that connect Waves to the major blockchain networks in the cryptocurrency sector.Data from Cointelegraph Markets Pro and TradingView shows that the price of WAVES has climbed 192% from a low of $8.37 on Feb. 24 to a daily high at $27.61 on March 9 as its 24-hour trading volume hit a record $2.13 billion. WAVES/USDT 1-day chart. Source: TradingViewWith the recent wave of economic sanctions pummeling Russia’s economy and the removal of easy payment rails, it’s possible that some people have turned to WAVES as one option for financial transactions and wealth preservation. VORTECS™ data from Cointelegraph Markets Pro began to detect a bullish outlook for WAVES on March 5, prior to the recent price rise. The VORTECS™ Score, exclusive to Cointelegraph, is an algorithmic comparison of historical and current market conditions derived from a combination of data points including market sentiment, trading volume, recent price movements and Twitter activity.VORTECS™ Score (green) vs. WAVES price. Source: Cointelegraph Markets ProAs seen in the chart above, the VORTECS™ Score for WAVES climbed into the green zone on March 5 and hit a high of 77 around four hours before the price began to increase 46% over the next three days.The views and opinions expressed here are solely those of the author and do not necessarily reflect the views of Cointelegraph.com. Every investment and trading move involves risk, you should conduct your own research when making a decision.

Čítaj viac

Získaj BONUS 8 € v Bitcoinoch

nakup bitcoin z karty

Registrácia Binance

Burza Binance

Aktuálne kurzy