Autor Cointelegraph By Jordan Finneseth

Multi-chain, stocks and stablecoin-focused DeFi protocols are showing signs of strength

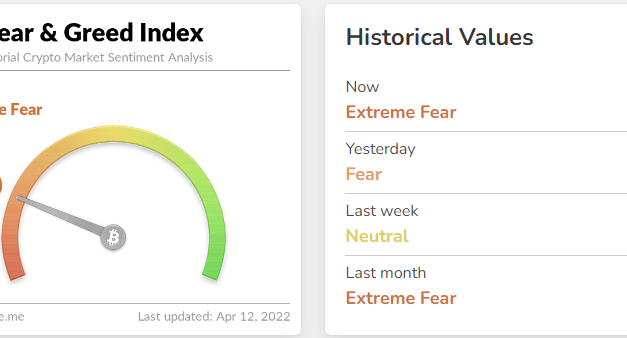
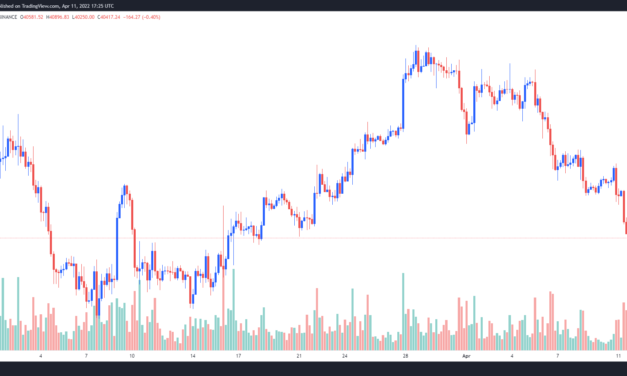
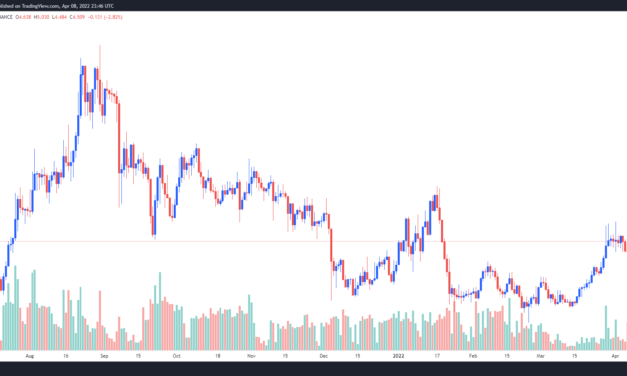
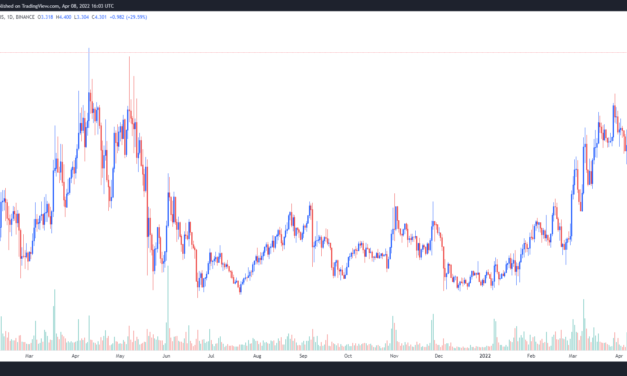
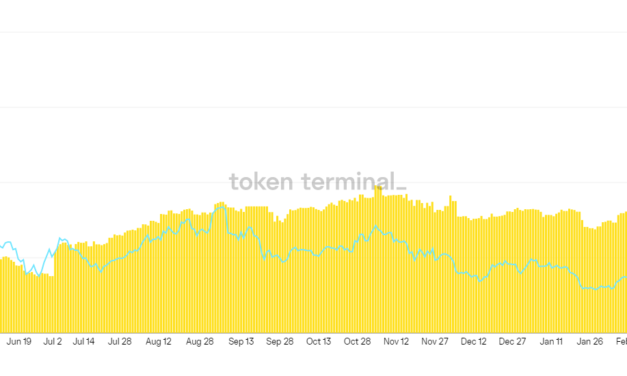
The cryptocurrency market has far faced an uphill battle for the larger part of 2022 due to global economic headwinds on multiple fronts, along with supply chain constraints, blistering inflation and the ongoing war in Ukraine. Despite the weakness seen in a majority of crypto assets, several decentralized finance (DeFi) protocols have managed to strengthen their fundamentals and entice new users to enter their ecosystems. Here’s a look at four protocols that are showing strength even as the wider crypto market struggles to gain footing. BalancerBalancer (BAL) is an automated market maker (AMM) on the Ethereum (ETH) blockchain that offers users a range of DeFi capabilities including the ability to stake tokens, provide liquidity, participate in governance voting and perform token swaps. According to data from Token Terminal, the total value locked (TVL) on Balancer is currently $3.54 billion, the third-highest TVL in the history of the protocol despite falling prices across the cryptocurrency market. Daily price vs. TVL for Balancer. Source: Token TerminalThe staying power of the Balancer TVL is due, in large part, to an increase in funds staked in stablecoin pools on the platform and a more involved governance mechanism that lets veBAL hodlers vote on which pools receive a majority of the BAL reward emissions. DeFiChainDeFiChain (DFI) is a DeFi protocol that was created through a fork of the Bitcoin code and operates in conjunction with the Bitcoin network to offer users access to crypto assets as well as tokenized stocks. Data from Defi Llama shows that the TVL of DeFiChain hit a new all-time high of $901.16 million on April 5 and currently sits at $831 million following the recent pullback in prices. Total value locked on DeFiChain. Source: Defi LlamaThe price of DFI has also remained relatively resilient compared to the wider crypto market and currently trades at $4.12 after hitting a high of $4.63 on April 3.The resiliency of DeFiChain is due, in part, to the continued development and expansion of the protocol, which recently added support for tokenized stocks for Walt Disney Co, iShares MSCI China ETF, MicroStrategy Incorporated and Intel Corporation. NEAR ProtocolNEAR protocol (NEAR) is a layer-one blockchain network designed as a community-run cloud computing platform capable of offering high transaction speeds at a low cost. 2022 has been a good year in general for the project and the price of NEAR hit an all-time high of $20.42 on Jan. 16 and the most recent rally saw the price rebound to $19.81 on April 7.NEAR/USDT 1-day chart. Source: TradingViewOn the DeFi front, things have never been this good for the NEAR protocol as the total value locked on the network is now at a record-high of $363.72 million, according to data from Defi Llama. Total value locked on NEAR. Source: Defi LlamaThe improving fundamentals for NEAR follow the successful completion of a $350 million funding round led by the New York-based hedge fund Tiger Global and speculation that the NEAR token could soon be listed on Coinbase. Related: Report: DApp daily users surge to 2.4M in Q1 2022 despite headwindscBridgeCeler’s cBrige, a multi-chain network that enables the transfer of assets across 26 different blockchain networks and layer-2 protocols, is also performing well.According to data from Defi llama, the cBridge hit a new all-time high TVL of $765.25 million on April 11 as the wider crypto market sold off and Bitcoin fell back below $40,000. Total value locked on cBridge. Source: Defi LlamaThe steadily climbing TVL for cBridge comes as the protocol continues to expand its list of supported networks, with some of the most recent additions including Astar, Crab Smart Chain, Milkomeda Cardano and Shiden. The overall cryptocurrency market cap now stands at $1.846 trillion and Bitcoin’s dominance rate is 40.9%.The views and opinions expressed here are solely those of the author and do not necessarily reflect the views of Cointelegraph.com. Every investment and trading move involves risk, you should conduct your own research when making a decision.

Čítaj viac

Bitcoin price slides below $40K following a ‘lackluster’ breakout

Extreme fear is once again the dominating sentiment across the cryptocurrency community after Bitcoin (BTC) faced another day of trading below the $40,000 level and the United States grapples with the highest Consumer Price Index (CPI) print since 1981. Crypto Fear & Greed Index. Source: Alternative.meData from Cointelegraph Markets Pro and TradingView shows that an early morning attempt to rally above $40,000 ran into a wall of resistance at $40,650 and BTC price eventually tumbled back below $39,600. BTC/USDT 1-day chart. Source: TradingViewHere’s a look at what several analysts are saying about the current state of Bitcoin and what could potentially come next as financial markets grapple with an increasing amount of uncertainty. Bitcoin is simply re-testing a major S/R zoneThe current price action for Bitcoin is largely seen as a retest of a major support and resistance (S/R) zone according to crypto analyst and pseudonymous Twitter user ‘Credible Crypto’, who posted the following chart outlining the multiple retests of this level going back to 2020.BTC/USD 1-week chart. Source: TwitterAccording to Credible Crypto, both the middle green circle and the last red circle provide past examples of intra-week movements that went above or below the weekly level, “but it means nothing without a close to confirm.” Credible Crypto said, “Give me a close below BLUE and I’ll change my tune, but for now there is no reason to.”Some analysts project a lackluster recoveryInsight into the on-chain behavior of Bitcoin investors was discussed in the most recent weekly report from Glassnode, which noted that there has been “a modest volume of profit-taking by investors” following the BTC breakout-out from a multi-month consolidation range. According to Glassnode, “the market has seen around 13,300 BTC in profits realized each day since mid-February” and while this value is not “historically extreme,” it does appear to “be providing sufficient headwinds to prices.”Bitcoin realized profit. Source: GlassnodeOverall, the recent recovery for Bitcoin has been relatively subdued with the market waiting for some major catalyst to help bring fresh momentum and new inflows into the cryptocurrency market. Glassnode said, “Especially across on-chain activity metrics like transaction counts and active users, the recovery has thus far been relatively lackluster and continues to suggest Bitcoin is a HODLer dominated market, with few new investors flowing in.”Related: Ethereum price ‘bullish triangle’ puts 4-year highs vs. Bitcoin within reachA “MEGA PUMP” is comingA strongly bullish narrative was highlighted by crypto trader ‘BTCfuel’, who posted the following chart outlining the possibility of an impending “mega pump” from Bitcoin. BTC/USDT 1-day chart. Source: TwitterBTCfuel said, “When looking at the RSI, the 2022 Bitcoin correction is very similar to 2021. Strong BULLISH move imminent.”The overall cryptocurrency market cap now stands at $1.850 trillion and Bitcoin’s dominance rate is 40.9%.The views and opinions expressed here are solely those of the author and do not necessarily reflect the views of Cointelegraph.com. Every investment and trading move involves risk, you should conduct your own research when making a decision.

Čítaj viac

Bitcoin price dip to $39.2K places BTC back in 'bear market' territory

The cryptocurrency market took a turn for the worse on April 11 after concerns related to rising inflation, the prospect of several more interest rates by the U.S. Federal Reserve and fear of a global food shortage led to widespread weakness across global financial markets.Data from Cointelegraph Markets Pro and TradingView shows that bears broke through the bulls’ defensive line at $42,000 in the early trading hours on Monday to drop Bitcoin (BTC) to a daily low of $39,200 and several analysts project even lower prices in the short-term.BTC/USDT 1-day chart. Source: TradingViewHere’s a look at what analysts are saying about Monday’s move lower and whether or not traders should expect more downside over the coming days.$40,000 or bustThe dip below $40,000 was foreshadowed by market analyst Michaël van de Poppe, who posted the following chart on Sunday highlighting the strong move in Bitcoin, but he also warned that “it’s the weekend and we still need to crack this resistance zone.”BTC/USD 4-hour chart. Source: TwitterAfter Monday’s pullback, van de Poppe posted a follow-up tweet addressing the rejection at $43,000 and offering insight into what level to keep an eye on as the next support. According to the trader, “the green zone” in the $43,000 to $44,000 range would need to become support to preserve any blossoming bullish momentum. This bear market is “different”BTC/USD 1-day chart. Source: TwitterInsight into the confusion that many crypto traders have been experiencing over the past year was provided by decentralized finance advisor and pseudonymous Twitter trader ‘McKenna’, who posted the following chart looking at the Bitcoin price action since April 2021. McKenna said that “this has been the weirdest bear market I’ve seen.”McKenna said, “I don’t even think we see sub $30,000, I’m more in favor of just choppy price action in this range which is also hell. Just need corn to chill and let my altcoins run.”A similar sentiment was expressed by crypto analyst and pseudonymous Twitter user ‘360Trader’, who posted the following chart highlighting the consolidation range Bitcoin has been trading in since last November. BTC/USD 1-day chart. Source: Twitter360Trader said, “Bitcoin consolidation continues… leverage is in control… float still drying up… This ain’t gonna last forever. Just slap a band-aid on and keep pushing.”Related: Bitcoin keeps falling as former BitMEX CEO gives $30K BTC price target for JuneWhere does Bitcoin go from here?A final bit of insight on the future of BTC price was provided by Philip Swift, markets analyst and founder of LookintoBitcoin, who posted the following chart showing the recent price rejection off the 1-year moving average (MA). BTC/USD 1-day chart. Source: TwitterAccording to Swift, the 1-year MA “has acted as a pivot point for bull v. bear markets throughout Bitcoin’s history.”Swift said, “Can’t really call it a bull market until we are convincingly back over the 1yr MA.”The overall cryptocurrency market cap now stands at $1.874 trillion and Bitcoin’s dominance rate is 41.4%.The views and opinions expressed here are solely those of the author and do not necessarily reflect the views of Cointelegraph.com. Every investment and trading move involves risk, you should conduct your own research when making a decision.

Čítaj viac

Kava turns bullish as Ethereum Co-Chain launch initiates push toward EVM compatibility

Protocols in the Cosmos ecosystem have seen a significant amount of growth in 2022 due to the intensifying focus on blockchain interoperability and compatibility with the Ethereum network. One protocol that has seen a buildup in momentum since the middle of March is Kava, a project that is developing a co-chain architecture for the Cosmos and Ethereum network.Data from Cointelegraph Markets Pro and TradingView shows that the price of Kava’s native token KAVA has climbed 72.3% after hitting a low of $2.92 on March 13 to establish a daily high of $5.03 on April 8. KAVA/USDT 1-day chart. Source: TradingViewThree reasons for the increase in price and momentum for KAVA include the Ethereum Co-Chain beta launch, the launch of a $750 million developer incentive program and a series of partnerships and protocol launches that have expanded the size of the Kava ecosystem. Ethereum Co-chain beta launchOne of the most anticipated developments to come out of the Kava ecosystem was the successful completion of the alpha phase of the Ethereum Co-chain launch. Ethereum Co-Chain Alpha was AMAZING!Beta is LIVE & already a powerhouse.Mainnet launches May 10th, 2022! #Kava #EVM pic.twitter.com/tnfyAkeLoN— Kava Network (@kava_platform) April 7, 2022The Ethereum Co-Chain enables support for Ethereum Virtual Machine (EVM) smart contracts while the Cosmos Co-Chain enables support for the Tendermint consensus engine and the Inter Blockchain Communication Protocol (IBC). A translator module connects the co-chains and allows for seamless interoperability between the networks. The mainnet launch of the Ethereum Co-Chain is expected to take place on May 10. Kava launches a $750 million developer incentive programA second reason for the building strength of KAVA was the March 3 launch of Kava Rise, a $750 million developer incentive program designed to help onboard developers from decentralized finance (DeFi), gaming and nonfungible projects into the Kava community. Kava Rise is an on-chain incentive mechanism that will distribute 62.5% of all block rewards to developers who are building on Kava’s Ethereum and Cosmos Co-Chains as part of the protocol’s effort to become a builder-owned network. The remaining 37.5% of block rewards will be distributed to stakers. The incentive program is expected to go live with the Kava 10 upgrade, which will also include the launch of the Cosmos and Ethereum Co-Chains on the Kava mainnet. Related: 3 reasons why Cosmos (ATOM) price is near a new all-time highNew partnerships and protocol launchesA third factor helping to boost the demand for KAVA has been the addition of new partnerships and protocols for the Kava network. Some of the newest protocols to launch on the Kava co-chain architecture include the NFT marketplace OpenBiSea, the decentralized finance launchpad DexPad and the DeFi piggy bank WePiggy. Other recent launches on Kava include the multichain DeFi lending protocol ForTube, the Ruby Protocol that brings the first algorithmic stablecoin to the Kava Ethereum Virtual Machine (EVM) and an Ethereum Co-Chain integration with the Ren protocol. VORTECS™ data from Cointelegraph Markets Pro began to detect a bullish outlook for KAVA on April 1, prior to the recent price rise. The VORTECS™ Score, exclusive to Cointelegraph, is an algorithmic comparison of historical and current market conditions derived from a combination of data points including market sentiment, trading volume, recent price movements and Twitter activity.VORTECS™ Score (green) vs. KAVA price. Source: Cointelegraph Markets ProAs seen in the chart above, the VORTECS™ Score for KAVA began to pick up on April 1, around 94 hours before the price increased 25% over the next three days. The views and opinions expressed here are solely those of the author and do not necessarily reflect the views of Cointelegraph.com. Every investment and trading move involves risk, you should conduct your own research when making a decision.

Čítaj viac

Kyber Network (KNC) soars after integrating with Uniswap v3 and Avalanche Rush Phase 2

The outlook for projects in the decentralized finance (DeFi) sector has begun to improve in recent months as a combination of global events have highlighted the benefits of holding funds outside of the traditional financial systems.One project that has rallied over the past few months is Kyber Network (KNC), a multi-chain cryptocurrency trading and liquidity hub that aims to offer users the best trading rates. Data from Cointelegraph Markets Pro and TradingView shows that after bouncing off a low of $2.83 on April 6, the price of KNC jumped 55.4% to hit an all-time high of $4.04 on April 8 amid a 253% spike in its 24-hour trading volume. KNC/USDT 1-day chart. Source: TradingViewThree reasons for the building momentum of KNC include the integration of support for ten separate blockchain networks, the launch of a liquidity mining program with Avalanche (AVAX) and an expanding list of partnerships and protocol integrations that expand the reach of the Kyber Network. Kyber Network adds multi-chain supportOne of the biggest factors providing a boost to Kyber Network is the protocol’s push to integrate with the top chains across the cryptocurrency ecosystem. KyberSwap, the main decentralized exchange interface on the network, now offers trading across ten separate networks, including Ethereum (ETH), Avalanche, Polygon (MATIC), BNB Smart Chain (BSC), Aurora, Arbitrum, Fantom (FTM), Oasis (ROSE), Velas (VLX) and Cronos (CRO). Interoperability has become one of the main themes driving growth not just in DeFi, but in all sectors of the crypto economy because the ability to send assets and data across multiple chains is a necessary feature in the future of DeFi, the NFT sector the Metaverse. As more chains come online, the ability to access them through one protocol is a desirable feature that many crypto and DeFi investors will come to expect.KNC joins Avalanche Rush Phase 2Another significant development that has helped attract increased attention and trading activity on the Kyber Network is the project’s partnership with the Avalanche Network and the Avalanche Rush Phase 2 liquidity mining program. The liquidity incentive program kicked off on March 21 and it includes a total of $1 million in rewards for liquidity providers. Avalanche is one of the fastest-growing Ethereum Virtual Machine (EVM) compatible networks in the cryptocurrency ecosystem and it has helped to attract more users and liquidity to the Kyber Network users by offering a low-fee alternative to Ethereum. New partnerships and protocol integrationsA third reason for the building momentum behind KNC is the continued addition of new partnerships and major protocol integrations that are helping to spread the reach of the network. On April 7, it was announced that KyberSwap integrated with Uniswap v3 on the Ethereum and Polygon network, bringing the most active decentralized exchange into the KyberSwap ecosystem. The project has also revealed a new partnership with the Bondex professional network and Kyber Ventures, the investment arm of the Kyber Network, established a working relationship with Pegacy, a popular NFT racing game. VORTECS™ data from Cointelegraph Markets Pro began to detect a bullish outlook for KNC on April 6, prior to the recent price rise. The VORTECS™ Score, exclusive to Cointelegraph, is an algorithmic comparison of historical and current market conditions derived from a combination of data points including market sentiment, trading volume, recent price movements and Twitter activity.VORTECS™ Score (green) vs. KNC price. Source: Cointelegraph Markets ProAs seen in the chart above, the VORTECS™ Score for KNC spiked into the green on April 6 and hit a high of 75 around nine hours before the price increased 55.4% over the next two days.The views and opinions expressed here are solely those of the author and do not necessarily reflect the views of Cointelegraph.com. Every investment and trading move involves risk, you should conduct your own research when making a decision.

Čítaj viac

Získaj BONUS 8 € v Bitcoinoch

nakup bitcoin z karty

Registrácia Binance

Burza Binance

Aktuálne kurzy