Autor Cointelegraph By Jordan Finneseth

Altcoins sell-off as Bitcoin price drops to its ‘macro level support’ at $38K

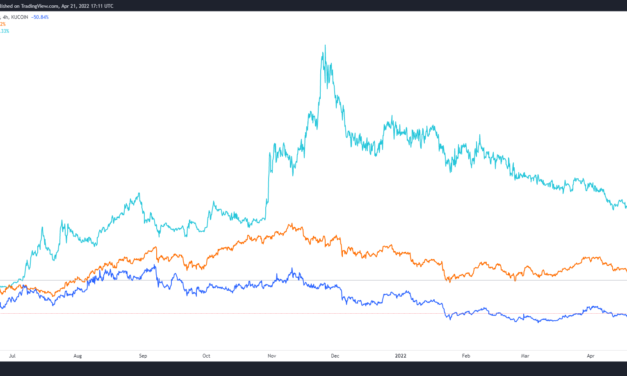
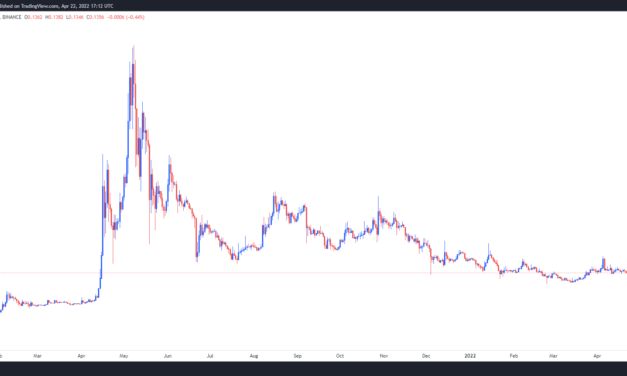
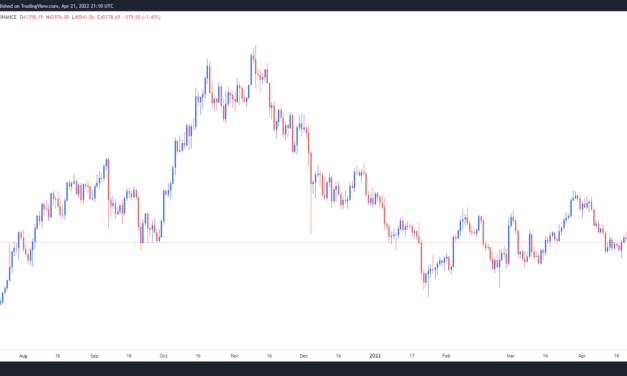
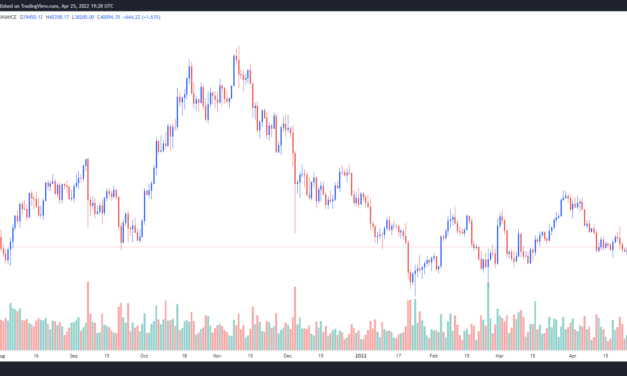
The cryptocurrency market and wider global financial markets fell under pressure on April 26 after the hype surrounding Elon Musk’s purchase of Twitter began to fade and concerns about the state of the global economy took the forefront again.Tech-related stocks were some of the hardest-hit assets on April 26 and this pullback was followed by sharp declines in crypto prices as risk assets become persona non grata in these turbulent markets. Data from Cointelegraph Markets Pro and TradingView shows that after holding support at $40,500 through the early trading hours on April 26, the price of Bitcoin (BTC) dumped 6.21% in afternoon trading to hit a low of $38,009. BTC/USDT 1-day chart. Source: TradingViewApril 26’s price action looks to be a continuation of the weakness seen across financial markets this month, and month-to-date, the S&P 500 is down by 7%, while the Nasdaq declined 11% and the Dow is nursing a 3% loss. The bearish trend in FAANG stocks has essentially been a weight that has dragged down the wider market and the recent 35% decline in the price of Netflix on April 20 highlighted a major kink in the “strong markets” narrative. Bitcoin retests its macro range lowApril 26’s sell-off in the price of Bitcoin has led many analysts to reiterate that we are headed for a bear market bottom, but not everyone has such a dire outlook, including crypto analyst and pseudonymous Twitter user Rekt Capital, who posted the following chart showing the price retesting a major support zone. BTC/USD 1-week chart. Source: TwitterRekt Capital said:“BTC is right back at the long-standing macro Higher Low support.”According to the analyst, BTC continues to trade within the range it has been stuck in since the beginning of the year and there is still a strong amount of support in the lower $30,000 range. Related: Bitcoin fails to hold $40K with traders still hoping for a BTC price relief bounceFurther insight into the weakness across global markets can be found by looking at the strong performance of the DXY, which is currently at its highest price in two years, according to crypto Twitter analyst Miles J Creative.DXY 1-day chart. Source: TwitterThe analyst said, “Dollar coming into the danger zone. To the moon or goblin town?”The fate of the market will likely hinge on how the dollar performs moving forward amid rising inflation, ongoing supply chain disruptions and the global conflict in Europe. Daily cryptocurrency market performance. Source: Coin360The overall cryptocurrency market cap now stands at $1.605 trillion and Bitcoin’s dominance rate is 45.5%.The views and opinions expressed here are solely those of the author and do not necessarily reflect the views of Cointelegraph.com. Every investment and trading move involves risk, you should conduct your own research when making a decision.

Čítaj viac

Bitcoin hits $40K, investors pump Dogecoin (DOGE) after Musk confirms Twitter purchase

The cryptocurrency market fell under pressure in the early trading hours on April 25, but a brief spurt of bullish price action sparked after media headlines announced that Elon Musk had reached a deal to purchase Twitter for $44 billion. Data from Cointelegraph Markets Pro and TradingView shows that after dropping as low as $38,210 in the opening trading hours on Monday, Bitcoin (BTC) price staged a 5.72% rally to hit an intraday high at $40,366 as news of Twitter’s sale spread across news outlets. BTC/USDT 1-day chart. Source: TradingViewHere’s a look at what analysts and on-chain data have to say about Bitcoin’s short-term outlook.Declining exchange reserves point to strong accumulationThe recent bearish sentiment that has dominated the crypto market was addressed by crypto trader and pseudonymous Twitter user ‘Phoenix’, who posted the following chart showing the decline in Bitcoin held on crypto exchanges, indicating that is point toward a strong accumulation phase.Exchange net position change for BTC. Source: TwitterPhoenix said, So what makes you think we would be at a point of distribution for BTC right now? These simple metrics tell me we’re at Accumulation for months again. You need a thing you maybe don’t have: PATIENCE.”Bitcoin is still bullish according to historical macro cycle bottomsOn-chain data firm Whalemap suggests that while the current correction is not over, a “generational bottom” is on the horizon and as the chart shows, buying these events tend to be very profitable for investors.Bitcoin realized price by address. Source: TwitterAs shown on the chart, the current price for BTC is well above the line that has previously marked the bottom of each macro cycle. This can be interpreted a couple of different ways – either the bearishness that has dominated the market is unwarranted at the current levels or the bull market outlook is still strong. Alternatively, one could infer that the market could be in for a real gut punch if the current weakness culminates with a final flush out to the sub-$20,000 region. Related: Bitcoin bears tighten their grip on BTC now that $40K is the new resistance levelWill there be bullish continuation above $39,610?A final bit of insight on Bitcoin’s future was offered by market analyst Michaël van de Poppe, who posted the following chart which highlighted $39,610 as a crucial level to overcome if bulls wanted to see more upside. BTC/USDT 4-hour chart. Source: TradingViewvan de Poppe said, “Great bullish divergence on Bitcoin and bouncing from higher timeframes level here. Looks ready for bullish continuation.”The overall cryptocurrency market cap now stands at $1.859 trillion and Bitcoin’s dominance rate is 41.2%.The views and opinions expressed here are solely those of the author and do not necessarily reflect the views of Cointelegraph.com. Every investment and trading move involves risk, you should conduct your own research when making a decision.

Čítaj viac

Altcoin Roundup: Crypto indexes offer broad access, but are they profitable in the long run?

The cryptocurrency market is known for its high volatility and the wild-west nature of the space is, in part, due to many of the assets having small market caps and the 24/7 operational hours of centralized and decentralized exchanges (DEXs).In addition to being high risk, crypto trading can also be a very time-intensive process. It can be an overwhelming task and a barrier to entry for most investors in determining which tokens to invest in. For these investors, index investing could be a profitable alternative for gaining exposure to some of the hottest sectors of the cryptocurrency market.Here’s a look at how crypto index products compare to individual tokens and which strategies have produced the biggest return. Index CooperativeIndex Cooperative (INDEX) is a decentralized autonomous asset manager that allows investors to create a custom index of tokens using smart contracts. Several of the most actively traded indexes originated from Index Coop, including the DeFi Pulse Index (DPI), Metaverse Index (MVI), Data Economy Index (DATA) and Bankless DeFi Innovation Index (GMI). Plotting the price of these indexes against the total market capitalization of the cryptocurrency market can help provide insight into how each one performed compared to the market as a whole. DPI/USDT vs. MVI/ETH vs. Total crypto market capitalization. Source: TradingViewSince May 29, 2021, which is when data first became available for DPI and MVI on TradingView, the weakness of the decentralized finance (DeFi) sector can be seen in the poor performance of DPI, which is currently down more than 50% while the total market cap has risen 19.82%.During that same period of time, the Metaverse index has increased 103% when compared to the price of Ether (ETH), and the gains are even greater when looking at its value in terms of USD. MVI/USD 1-day chart. Source: CoinGeckoAs seen on the chart above, the price of MVI has increased from $42.02 on May 29 to its current value of $118.06, reflecting a gain of 180% compared to the 20% rise in the total market cap. Metaverse and nonfungible token (NFT)-related projects have been a bright spot in an otherwise weak market over the past six months and in this instance, it was beneficial to be invested in a basket of metaverse tokens. Tokens in the Metaverse Index. Source: Index CooperativeThe Data Economy Index and Bankless DeFi Innovation Index have both posted losses since launching. This mirrors the performance of the wider crypto market, which has been in a downtrend since peaking in early November 2022. NFT IndexNFTs have been one of the hottest sectors of the past year, but finding the next big crowd-pleaser is a monumental challenge because dozens of new NFT projects launch on a daily basis. An alternative for gaining exposure is the NFT Index (NFTI), a basket that contains 11 different tokens including Polygon (MATIC), ApeCoin (APE), The Sandbox (SAND) and Decentraland (MANA).NFTI/USD 1-day chart. Source: CoinGeckoThe price of NFTI has increased from $386 on March 5, 2021, to its current price of $1,724, a gain of nearly 350%. During that same period of time, the total crypto market capitalization rose by 30%, providing evidence of the strength the NFT market has seen over the past 13 months. eToro basketsFor those looking for exposure to crypto baskets in a more regulated environment, eToro, a multi-asset brokerage firm, provides access to several “smart portfolio” options that have performed well over the past year. Top 2 smart portfolios. Source: eToroThe Napoleon-X smart portfolio is a basket comprising some of the more established projects in the crypto market, including Bitcoin (BTC), Ether, BNB, Litecoin (LTC) and Cardano (ADA). The DeFiPortfolio contains a large allocation of Ether along with smaller allocations to other projects that are involved in the DeFi sector including Polygon and Algorand. As shown in the graphic above, these portfolios have provided returns of 48.6% and 45.3% over the past year while the total crypto market cap has actually declined 5.71% during the same time period. On a two-year time scale, several of the eToro portfolios have offered returns in excess of 430% including Napoleon-X, which has experienced an increase of 709.3%. During that same time period, the total crypto market cap has increased 808%, while the price of BTC has increased by 472%. Top portfolios over the past 2years. Source: eToro.This suggests that indexes offer the opportunity to capture a large percentage of the overall gains in the market while offering a better return. In many instances, this is a better tactic than trying to pick individual tokens that will see the biggest gains. The results for DeFiPortfolio also highlight the importance of taking profits when big gains are made because they have a tendency to slip away as traders rotate or whipsaw price movements occur.Want more information about trading and investing in crypto markets?The views and opinions expressed here are solely those of the author and do not necessarily reflect the views of Cointelegraph.com. Every investment and trading move involves risk, you should conduct your own research when making a decision.

Čítaj viac

Memecoins eye major revamps in an effort to return to their former glory

Memecoins briefly took the cryptocurrency market by storm in 2021 after steady attention and shilling from big-name influencers like Elon Musk and Mark Cuban helped propel coins like Dogecoin (DOGE) to 100x gains. As one should expect, in the crypto market, rapidly rising prices have a tendency to reverse course just as fast and many of the formerly high-flying meme tokens now find themselves struggling for survival as the market matures and investors look for real-world use cases.Let’s take a look at some of the most popular memecoins of 2021 to see whether they were just a flash in the pan or if there are fundamental developments that may prove fruitful in the long-term. Dogecoin DOGE is the original memecoin and it helped kick off the rally of ‘21 after its price skyrocketed more than 20,000% from a low of $0.0036 on January 1, 2021 to an all-time high of $0.74 on May 8. DOGE/USDT 1-day chart. Source: TradingViewSince that time, the price has deflated along with the wider crypto market and currently trades at a $0.135.Out of all the memecoins, DOGE continues to be the most high profile of the pack despite not having any major developments in the works. It remains one of Elon Musk’s favorite Twitter topics and its price saw a notable bump recently when Musk started making offers to buy Twitter and take it private. The move by Musk led to speculation that DOGE could be added as a tipping currency on the social media platform if the deal eventually goes through, which led to a brief pump in the price of DOGE.Details about what comes next for Dogecoin are sparse with some chatter still circulating about earlier discussions to make the network proof-of-stake, but nothing concrete has been announced. One developer for the project will be holding a workshop exploring messaging services within person-to-person protocols like Dogecoin, indicating that there is some exploration into other possible use cases for the longest-running meme-themed network. Shiba InuWhile Dogecoin receives a lot of the big influencer attention, Shiba Inu (SHIB) had one of the biggest impacts on the meme scene in 2021 after its price increased more than 5,799,999,900% from its low in October 2020 and helped one savvy trader turn a $3,400 bet into a $1.5 billion payday. SHIB/USDT 1-day chart. Source: CoinGeckoThe price of SHIB currently trades at $0.000024, a decline of 73% from its all-time high, and the token regularly sees a daily trading volume in excess of $500 million. SHIB holders experienced a slight bump in price on April 12 when the token was listed on the popular trading app Robinhood, but the continued weakness in the crypto market has all but erased those gains. On the development front, the team at Shiba Inu is currently focusing its efforts on expanding the Metaverse capabilities of SHIB through the launch of a land bid event that offers members of the Shiba Inu community the opportunity to buy virtual land within the ecosystem. The roadmap for the project also points to the ongoing development of Shibarium, a layer-two scaling solution being designed specifically for Shiba Inu that will help the protocol escape the high fees of transacting on the Ethereum (ETH) network. Related: AMC Theatres mobile app accepts Dogecoin, Shiba Inu and moreSafeMoonSafeMoon (SFM) also launched early-on in the meme coin hype cycle and set out to reward loyal investors and discourage speculators through the creation of an automatic liquidity pool. The project originally launched on March 8 and its price rapidly climbed from sub $0.00000006 to an all-time high of $0.00001399 on April 20, 2021, but it has been on a downtrend since then. At the beginning of 2022, the Safemoon protocol upgraded to v2, which included a token revaluation that decreased the supply by a factor of 1,000. SFM/USDT 1-day chart. Source: CoinGeckoSince the migration to v2, the price of SFM has continued to trend lower and currently trades at $0.00068 according to data from CoinGecko. On the development front, Safemoon announced that it would be launching the Safemoon Card for community members and this would allow them to use their SFM as well as other cryptocurrencies to make daily purchases. The waiting list for the card opened on April 8. Other developments include the release of a new version of the Safemoon wallet, the launch of Live Crypto Party, a “party-to-earn” metaverse platform that rewards users in cryptocurrency and NFTs for having fun online and offline. The views and opinions expressed here are solely those of the author and do not necessarily reflect the views of Cointelegraph.com. Every investment and trading move involves risk, you should conduct your own research when making a decision.

Čítaj viac

Analyst suggests swing trading Bitcoin is the best move as BTC price dips below $40K

Bitcoin (BTC) price flashed bullish for a brief moment, possibly tricking some traders into opening longs, before plunging back below $40,000 in evening trading hours. Let’s take a quick look at what traders think about the current price action and whether or not today’s brief break out was nothing more than test of overhead resistance.BTC/USDT 1-day chart. Source: TradingViewResistance remains at key moving averagesAnalysis of Bitcoin’s weekly price action was discussed by crypto trader and pseudonymous Twitter user ‘Rekt Capital’, who posted the following weekly chart noting that “Bitcoin is now hovering below the green 21-week and blue 50-week bull market exponential moving averages (EMA).”BTC/USD 1-week chart. Source: TwitterRekt Capital said, “Breaks beyond these EMAs have preceded immense upside. Turn these Bull Market EMAs into support and we’ll see Bull Market momentum resume.”Bitcoin’s correlation to tech stocks provides insightDespite all the macro factors affecting global financial markets, Bitcoin remains “stuck in the middle of its $35,000 to $45,000 range according to David Lifchitz, managing partner and chief investment officer at ExoAlpha. Lifchitz noted that BTC has behaved more like a risk asset than an inflation hedge. Evidence for this can be found by looking at the highly correlated price action for BTC and the Nasdaq over the past few months. BTC/USD vs. Nasdaq futures. Source: RefinitivAccording to Lifchitz, if Bitcoin’s “correlation with speculative tech stocks remains high,” the planned series of interest rate hikes by the U.S. Federal Reserve will at some point “become toxic to risk assets” which could translate into declines in the price of Bitcoin. Overall, Lifchitz suggests that for investors who are convinced of its long-term potential, “Bitcoin should be actively traded while it bounced up and down in the range.” Related: From beer to Bitcoin as legal tender: A BTC education in Roatán$42,300 is a crucial level to watchAccording to independent market analyst Michaël van de Poppe, $42,300 is the crucial level that needs to be overcome. BTC/USD 4-hour chart. Source: TwitterVan de Poppe said, “This is also a daily breaker. If it breaks, I’m assuming a new test of $46,000 is around the corner and possibly $50,000.”Further evidence that suggests BTC could soon trend higher was provided by analyst and pseudonymous Twitter user ‘Plan C’, who posted the following chart looking at the confluence of several analytical measures for Bitcoin price. Bitcoin confluence floor model. Source: TwitterPlan C said, “The last 4 times the blue & purple lines were below the green line for this long the Bitcoin bottom was already in.”The overall cryptocurrency market cap now stands at $1.881 trillion and Bitcoin’s dominance rate is 41.2%.The views and opinions expressed here are solely those of the author and do not necessarily reflect the views of Cointelegraph.com. Every investment and trading move involves risk, you should conduct your own research when making a decision.

Čítaj viac

Získaj BONUS 8 € v Bitcoinoch

nakup bitcoin z karty

Registrácia Binance

Burza Binance

Aktuálne kurzy