Autor Cointelegraph By Jordan Finneseth

Bitcoin price hits $24K, but analysts say on-chain data points to an ‘inevitable’ pullback

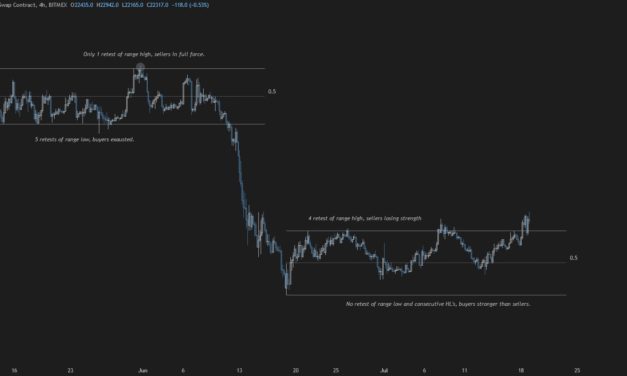
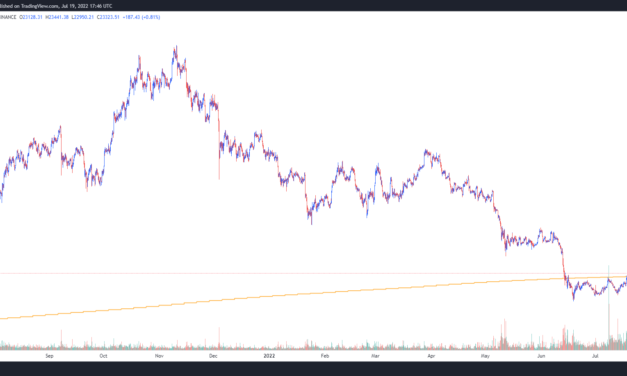
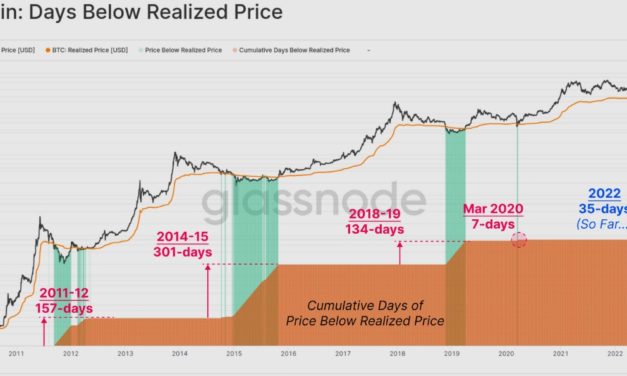
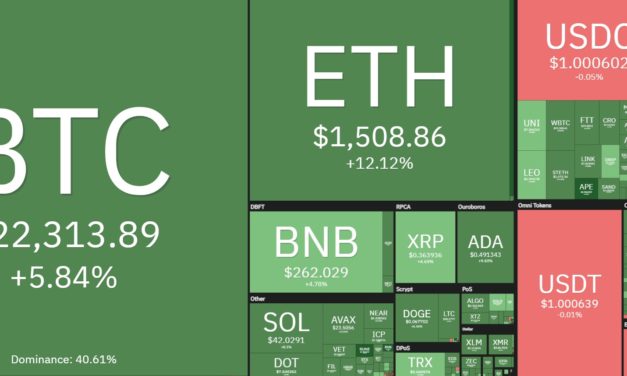
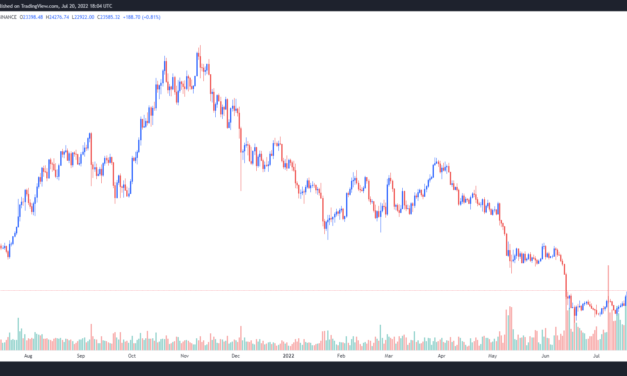
Cryptocurrency investors continue to enjoy this week’s bullish price action after Bitcoin (BTC), Ether (ETH) and a handful of altcoins rallied on July 20 alongside gains in the traditional markets. Data from Cointelegraph Markets Pro and TradingView shows that a midday rally by Bitcoin bulls managed to lift the top crypto to a daily high of $24,281, which sparked a new round of bullish proclamations on Crypto Twitter. BTC/USDT 1-day chart. Source: TradingViewWhile the week-long climb has helped boost investor sentiment, several analysts are warning traders to not get too far ahead of themselves because the market is still providing some red flags worth taking note of. Prepare for an inevitable pullbackBitcoin’s climb above $24,000 officially confirmed a breakout from the previous trading range between $18,000 and $22,500, according to market analyst Caleb Franzen, who posted the following chart noting the question the market now faces. BTC/USD 1-day chart. Source: TwitterFranzen said, “Regardless, my belief is that the next pullback will be a major test within this bear market. Will buyers step in aggressively on a pullback or capitulate?Whale wallets remain dormantOne reason to be wary of the current rally’s ability to sustain itself is the lack of whale wallet activity, according to on-chain research firm Jarvis Labs. Bitcoin divergence chart. Source: Jarvis LabsThe red and orange dots on the BTC divergence chart above represent buying activity by large and small whale wallets at different points in time. As shown in the red highlighted box, activity from whales has been almost non-existent over the past few months as Bitcoin trended down. Data from Jarvis Labs also showed that larger entities have yet to return to active buying, and the chart below shows the change in BTC whale holdings. BTC whale holding change. Source: Jarvis LabsJarvis Labs said, “We want to see this pattern of colored dots begin moving up and to the right. If we get it, then that’ll be a positive sign that any rally could have significant momentum behind it.”Based on the trends identified, Jarvis Labs stated that “it is hard to get too excited about a rally extending beyond the liquidity that sits around $28,000,” and instead suggested that “For now, the lower band at $25K seems most likely.”Related: Bitcoin may hit $120K in 2023, says trader as BTC price gains 25% in a weekThe high time frame trend remains bearishThe turnaround in sentiment over the past week was acknowledged by market analyst and swing trader il Capo of Crypto, who noted that the “Low timeframe trend is bullish, no doubt about it.”But before jumping all in on this rally, il Capo of Crypto also posted the following chart warning that the “high timeframe trend is still bearish and this is another lower high.” BTC/USD 12-hour chart. Source: TwitterIl Capo of Crypto said, “Ltf [low time frame] bearish confirmation is below $22K. Main target remains $15.8K-$16.2K.”The overall cryptocurrency market cap now stands at $1.062 trillion and Bitcoin’s dominance rate is 42.7%.The views and opinions expressed here are solely those of the author and do not necessarily reflect the views of Cointelegraph.com. Every investment and trading move involves risk, you should conduct your own research when making a decision.

Čítaj viac

Bitcoin price holds $23.5K, leading bulls to say ‘it’s different this time’

Similar to Stockholm syndrome where captives develop a psychological bond with their captors, crypto winters have a way of flipping even the most bullish cryptocurrency supporters bearish in a short period of time.Evidence of this reality was on full display on July 19 after the recovery of Bitcoin (BTC) back above $23,000 was met with widespread warnings that the move was merely a fakeout before the market heads for new lows $BTCNot bad. But keep in mind that this still can turn into a classical fake out.My general thesis still remains, bear market rally pic.twitter.com/VxnH4mo6hW— Jimie (@Your_NLP_Coach) July 19, 2022While the possibility of new lows being set in the future can’t be ruled out, here’s a look at analysts’ opinions on how this BTC breakout could be different than most investors expect.This time “it’s different”The pointed message of “this time is different” was offered by pseudonymous Twitter user Trader XM, who posted the following chart outlining why BTC is poised to head higher. BTC/USD 4-hour chart. Source: TwitterAs highlighted on the chart above, BTC price did not retest of the range low even as four retests of the range high took place, and this suggests that buyers are now stronger than sellers. In response to the post from Trader XM, Twitter user Justiinape replied “$27K-$28K seems imminent.” Trader XM said, “Agree my man, move to $27-28K then months of consolidation. Let’s enjoy this move before the long hibernation.”The next major resistance is at $27,100Further evidence that BTC could head higher was supplied by the on-chain data firm Whalemap, which posted the following chart highlighting the lack of buying demand between $23,000 and $27,000. Bitcoin volume profile. Source: TwitterWhalemap said, “$27,100 should be the first resistance on our way up. Big gap in supply between current prices and $27K.”Related: Bitcoin price moves toward $24K and traders expect further upside, after a support retestShorts get REKTProof that crypto traders had been lulled into an overly bearish outlook was provided by cryptocurrency analyst Dylan LeClair, who posted the following chart showing the effect that Bitcoin’s move above $23,000 had on the futures traders. BTC/USD 2-hour chart. Source: TwitterAs highlighted on the chart, there was a large amount of Bitcoin short positions opened between June 15 and July 15 and these traders now find themselves on the losing side of the trade. LeClair said,“Tens of thousands worth of BTC short open interest currently underwater.” While Bitcoin reversing course and heading lower once again remains a possibility, the current momentum suggests further upside in the short term.The overall cryptocurrency market cap now stands at $1.055 trillion and Bitcoin’s dominance rate is 42.1%.The views and opinions expressed here are solely those of the author and do not necessarily reflect the views of Cointelegraph.com. Every investment and trading move involves risk, you should conduct your own research when making a decision.

Čítaj viac

Bitcoin price moves toward $24K and traders expect further upside, after a support retest

Crypto fans are rejoicing at the sight of green across the market on July 19 as the months of “down only” price action has finally come to an end after the market flashed its first substantial relief rally in at least a month. Data from Cointelegraph Markets Pro and TradingView shows that much of the newfound excitement is the result of Bitcoin (BTC) breaking above resistance at $23,000 to hit a daily high of $23,447, its first meaningful move above the 200-week moving average. BTC/USDT 1-day chart. Source: TradingViewWhile many have been quick predict a climb to the mid-$30,000 range, a few analysts caution that it could be another fakeout pump. Let’s take a look at traders’ perspectives on Bitcoin’s move toward $33,000.Bitcoin needs a weekly candle close above $22,800The move back above the 200-week MA has been a point of focus for cryptocurrency analyst Rekt Capital, who posted the following chart commenting that “For the first time in weeks, BTC is putting in a decent effort to try to reclaim the 200-week MA as support.”BTC/USD 1-week chart. Source: TwitterThe 200-week MA has been a highly watched metric in recent weeks because it has served as a reliable bear market indicator that has historically provided insight into when a bottom has been set. Rekt Capital said,“#BTC needs to Weekly Candle Close above $22800 to successfully confirm a reclaim of the 200-week MA as support.”There’s still room for a pullback to $18,000Further insight into what would need to happen to confirm a bullish perspective on the gains seen on July 19 was offered by Phoneix ICF, who provided the following chart highlighting the next major level of resistance to keep an eye on. BTC/USDT 1-day chart. Source: TwitterPhoenix ICF said, “Wait for the 1d candle to close above $23K and then place long bets. If that’s not the case, we’ll see it below $18K soon. Be patient & avoid emotional trading.”Related: Technicals suggest Bitcoin is still far from ideal for daily paymentsTraders expect resistance at $28,400The importance of the current price level was further explored by technical analyst Crypto Patel, who posted the following chart outlining the possible paths that BTC could take in the event of a sharp directional move from the current supply zone found between $21,700 and $22,800.BTC/USDT 1-day chart. Source: TwitterCrypto Patel said, “Scenario 1:- If Break $22,900 Level then Ready for Long with $28,400 TP [take profit]. Scenario 2:- But If failed to hold $$22,800 then High Possibility to test $12K Level.”Based on the current Bitcoin price, the chart above predicts a possible run-up to the resistance area near $28,400, followed by a consolidation or pullback before BTC attempts to take out the resistance found at $32,300. The overall cryptocurrency market cap now stands at $1.062 trillion and Bitcoin’s dominance rate is 42.1%.The views and opinions expressed here are solely those of the author and do not necessarily reflect the views of Cointelegraph.com. Every investment and trading move involves risk, you should conduct your own research when making a decision.

Čítaj viac

Data points to a Bitcoin bottom, but one metric warns of a final drop to $14K

“When will it end?” is the question that is on the mind of investors who have endured the current crypto winter and witnessed the demise of multiple protocols and investment funds over the past few months.This week, Bitcoin (BTC) once again finds itself testing resistance at its 200-week moving average and the real challenge is whether it can push higher in the face of multiple headwinds or if the price will trend down back into the range it has been trapped in since early June. According to the most recent newsletter from on-chain market intelligence firm Glassnode, “duration” is the main difference between the current bear market and previous cycles and many on-chain metrics are now comparable to these historical drawdowns. One metric that has proven to be a reliable indicator of bear market bottoms is realized price, which is the value of all Bitcoin at the price they were bought divided by the number of BTC in circulation. Number of days Bitcoin price traded below the realized price. Source: GlassnodeAs shown on the chart above, with the exception of the flash crash in March 2020, Bitcoin has traded below its realized price for an extended period of time during bear markets. Glassnode said, “The average time spent below the Realized Price is 197-days, compared to the current market with just 35-days on the clock.”This would suggest that the current calls for an end of the crypto winter are premature because historical data suggests the market still has several months of sideways price action to go before the next major uptrend. Will the bottom be closer to $14,000?When it comes to what traders should be on the lookout for that would signify an end to the winter, Glassnode highlighted the Delta price and Balance price as “on-chain pricing models which tend to attract spot prices during late stage bears.”Bitcoin realized, balances and delta prices. Source: GlassnodeAs shown on the chart above, the previous major bear market lows were set after a “short-term wick down to the Delta price,” which is highlighted in green. A similar move in today’s market would suggest a BTC low near $14,215. These bearish periods also saw the BTC price trade in an accumulation range “between the Balanced Price (range low) and the Realized Price (range high),” which is where the price currently finds itself. One of the classic signs that a bear market is coming to an end has been a major capitulation event that exhausted the last remaining sellers. While some are still debating whether or not this has occurred, Glassnode highlighted the on-chain activity during the June plunge to $17,600 as a possible sign that capitulation has indeed taken place. Bitcoin total supply in loss. Source: GlassnodeAt the time that BTC fell to $17,600, there was a total volume of 9.216 million BTC holding an unrealized loss. Following the capitullation event on June 18, a month of consolidation and a price rally to $21,200, this volume has now declined to 7.68 million BTC. Glassnode said, “What this suggests is that 1.539M BTC were last transacted (have a cost-basis) between $17.6k and $21.2k. This indicates that around 8% of the circulating supply has changed hands in this price range.”Further evidence of capitulation having already taken place was the “staggering volume of BTC” that locked in a realized loss between May and July. Bitcoin 30-day sum realized losses. Source: GlassnodeThe collapse of Terra triggered a total realized loss of $27.77 billion while the June 18 plunge below the 2017 cycle all-time high resulted in a total realized loss of $35.5 billion. Related: Sub-$22K Bitcoin looks juicy when compared to gold’s market capitalizationIs this the end of the bear market?One final metric that suggests capitulation has already occurred is the Adjusted Spent Output Profit Ratio (aSPOR), which compares the value of outputs at the time they are spent to when they were created. Bitcoin adjusted SPOR. Source: GlassnodeAccording to Glassnode, when profitability is declining (as represented by the blue arrows), investors being to realize large losses which eventually leads to “a final waterfall moment of capitulation,” which is highlighted in red. Glassnode said, “The market eventually reaches seller exhaustion, prices start to recover, and investor pain starts to subside.”In order to verify that capitulation has indeed taken place and accumulation is underway, Glassnode indicated that the aSOPR value would ideally need to recover back above 1.0. The views and opinions expressed here are solely those of the author and do not necessarily reflect the views of Cointelegraph.com. Every investment and trading move involves risk, you should conduct your own research when making a decision.

Čítaj viac

Total crypto market cap reclaims $1 trillion as Bitcoin, Ethereum and altcoins breakout

Crypto traders found cause for celebration on July 18 as the total market capitalization climbed back above the $1 trillion mark following weeks of widespread selling after Bitcoin (BTC) price swept yearly lows below $18,000.The green day for cryptocurrencies largely tracks a positive day in the traditional markets, which are up modestly despite analyst estimates that the Federal Reserve intends to raise interest rates by at least 75 basis points at the Federal Open Market Committee meeting on July 27. Daily cryptocurrency market performance. Source: Coin360While traders will welcome July 18’s positive price action, many analysts caution that the upswing is nothing more than a bear market pump. Let’s take a look at the current top performers.Bitcoin holds a 16% gainData from Cointelegraph Markets Pro and TradingView shows that over the past week, Bitcoin has rallied significantly and at the time of writing BTC holds a 16% weekly gain from its recent low at $18,907. BTC/USDT 1-day chart. Source: TradingViewThe top cryptocurrency now finds itself running square into the resistance found at its 200-week moving average, which also happens to be the upper bound of the trading range BTC has been trapped in since the middle of June. This level has proven to be a tough nut to crack over the past five weeks as multiple attempts to break above it have been met with rejection. It remains to be seen if Bitcoin will manage to break free of this level and move higher or spend longer trading between $19,000 and $22,000. $BTC battling that 200 Week MA again. Rejected 3 times in the last 5 weeks here.Decision time imo.We either have a fat breakout or fat breakdown. $ETH has been leading the market so far, along with many other altcoins. Breakouts occurring everywhere.Can $BTC follow suit? pic.twitter.com/6Cz49po8CH— Taner ⚡️ (@Taner_Crypto) July 18, 2022Ethereum Merge surge presents a 43% rallyEthereum (ETH) has also experienced a boost in momentum and price over the past week, climbing 43% from a low of $1,005 on July 13 to a daily high at $1,530 on July 18, reaching its highest price since June 12.ETH/USDT 1-day chart. Source: TradingViewEther has been showing increased momentum since the successful July 6 completion of the Merge on the Sepolia testnet. A further boost to its price was provided on July 15 when it was announced that the mainnet Merge is predicted to take place on September 19.While the September 19 date is still tentative and should be considered as a roadmap projection and not a hard deadline, the prospect of the Merge finally taking place after years of preparation is exciting the community and possibly driving demand for Ether. Related: Bitcoin price nears critical 200-week moving average as Ethereum touches $1.5KMATIC keeps movingOn the altcoin front, Polygon (MATIC) continues to lead the pack higher following a week of several major announcements including being selected to participate in Disney’s 2022 Accelerator Program, gaining 32.4% over the past 24 hours and trading near resistance at $0.94. MATIC/USDT 1-day chart. Source: TradingViewOther notable gainers on the 24-hour chart include a 19.6% gain for STEPN (GMT), an 18.9% gain for Theta Fuel (TFUEL), and a 17.6% increase for Convex Finance (CVX). The overall cryptocurrency market cap now stands at $1.019 trillion and Bitcoin’s dominance rate is 41.6%.The views and opinions expressed here are solely those of the author and do not necessarily reflect the views of Cointelegraph.com. Every investment and trading move involves risk, you should conduct your own research when making a decision.

Čítaj viac

Získaj BONUS 8 € v Bitcoinoch

nakup bitcoin z karty

Registrácia Binance

Burza Binance

Aktuálne kurzy