Autor Cointelegraph By Jordan Finneseth

Analysts say Ethereum price must hold this key level to avoid a capitulation-level move

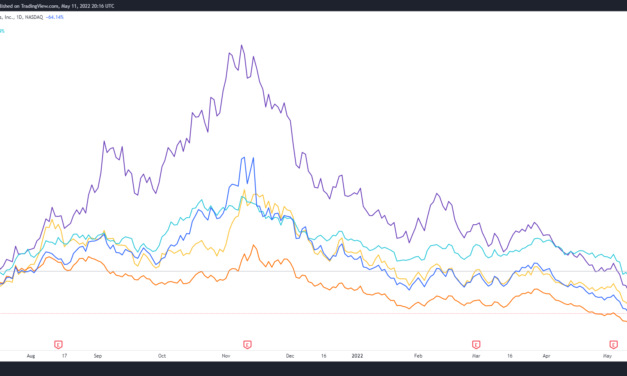
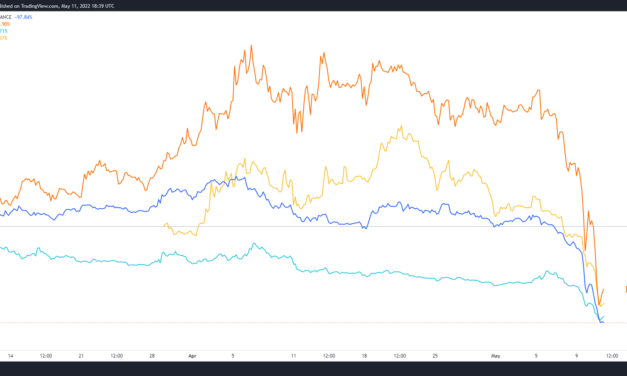
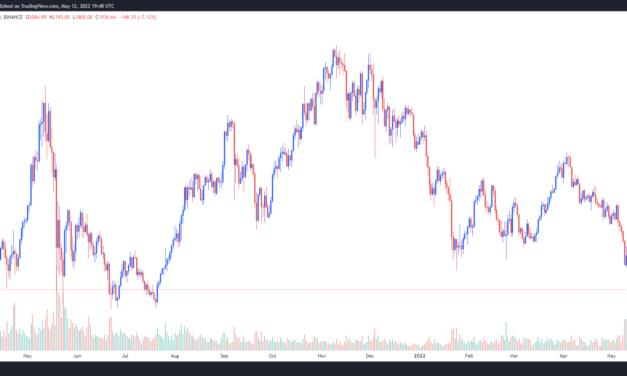
The crypto market experienced another day of pain on May 12 as the fallout from the Terra’s LUNA and UST failure continues to ripple across the ecosystem.While the coverage for UST and its impact on Bitcoin (BTC) have been extensively covered over the past few days, the pullback has also had a significant impact on the price of Ether (ETH) as traders hastily exited the market. Data from Cointelegraph Markets Pro and TradingView shows that the past seven days of selling dropped Ether to $1,701, a price not seen since July 2021. ETH/USDT 1-day chart. Source: TradingViewHere’s a look at what several analysts are saying about the outlook for Ethereum and what support and resistance levels to keep an eye on. Ether needs to reclaim $2,250The overnight plunge to the low $1,700 range was documented by crypto analyst and pseudonymous Twitter user ‘Rekt Capital’, who posted the following chart outlining the major support and resistance zones for Ether.ETH/USD 1-month chart. Source: TradingViewRekt Capital said:“If Ether isn’t able to rebound strongly from here so as to Monthly Close above the black ~$2,250 level above, the ~$1,720 will reveal weakness and may not hold price.”Should a further breakdown in price occur, Rekt Capital indicated that the blue zone on the chart is the “ next major support sub ~$1720,” which is located near $1,350. Bouncing off the 2021 summer lowsInsight into what Ether’s price action may look like should it head lower was provided in the following tweet by ‘Crypto Feras’, who mused that just a few weeks ago it sounded crazy to talk about Ether falling to these levels. ETH/USDT 1-day chart. Source: TradingViewCrypto Feras said:“Technically Ether is bouncing off its 2021 summer lows (outperforming Bitcoin so far). The bounce areas are either this $1,700 – $1,800 [range] or we [are] gonna have to test [the] $1,400 zone.”Related: How long will the crypto bear market last? Raoul Pal’s macro analysisPossible short-term retest of $1,550A longer-term view of the Ether’s price action was discussed by market analyst Caleb Franzen, who suggested that a “bearish” breakdown below a major trendline. ETH/USDT 1-week chart. Source: TwitterFranzen said:“Very possible that we retest the January 2018 highs, around $1,550, in the next 24 hours. If/when we break below that former resistance level, that’s another bearish signal.”The overall cryptocurrency market cap now stands at $1.219 trillion and Ether’s dominance rate is 19.2%.The views and opinions expressed here are solely those of the author and do not necessarily reflect the views of Cointelegraph.com. Every investment and trading move involves risk, you should conduct your own research when making a decision.

Čítaj viac

Crypto-associated stocks hammered as COIN and HOOD drop to record lows

Bad news continues to dominate crypto media headlines and May 12’s juiciest tidbit was the unexpected collapse of the Terra ecosystem. In addition to the weakness seen in equities, listed companies with exposure to blockchain startups and cryptocurrency mining have also declined sharply.Bitcoin mining stocks continue bleeding…Mining investors probably wish they had simply bought bitcoin instead at the beginning of 2022, as most bitcoin mining stocks have underperformed bitcoin by a wide margin. pic.twitter.com/anSoUEoUJ1— Jaran Mellerud (@JMellerud) May 11, 2022While it may be easy to blame the current pullback solely on Terra’s implosion, the truth is that the price of Bitcoin mining stocks has largely mirrored the performance of BTC since reaching a peak in November 2020. BTC/USDT vs. RIOT, HUT, MARA and BITF .1-day chart. Source: TradingViewIt’s likely that the price of these stocks will struggle as long as Bitcoin continues to bleed lower in the face of multiple headwinds, including rising interest rates, inflation and global conflict. Crypto financial services also correctIt’s not just Bitcoin mining stocks that have fallen under the pressure of late as all manner of companies with any kind of association with cryptocurrencies have been feeling the heat in May. Following the release of forward-looking statements that project a continued decline in active users and trading volume, the price of Coinbase (COIN) stock hit an all-time low of $41.23 in the early trading hours on May 12. COIN price 4-hour chart. Source: TradingViewRobinhood also saw its stock price drop to a new all-time low of $7.73 on May 12, one day after the firm revealed that its crypto transaction revenue fell 39% year-over-year in Q1 from $88 million in 2021 to $54 million in 2022. While Robinhood is not a crypto-only exchange, roughly 18% of its Q1 net revenue came from crypto-related transactions, which is significant when comparing the size of the crypto market to the other markets supported on the platform. Related: Bitcoin fights to hold $29K as fear of regulation and Terra’s UST implosion hit crypto hardWeakness spreads throughout the tech sectorThe declines in cryptocurrency-related stocks mirror a backdrop of widespread weakness in financial markets, especially the tech sector.Several years of optimistic projections and quantitative easing have resulted in an overvalued and volatile tech sector that throws fits if earnings fall below expectations. Once the darlings of the mighty stock market, FAANG stocks have led the charge lower, weighing down the Nasdaq, which closed April with its worst monthly performance since the 2008 financial crisis. NASDAQ composite 1-day chart. Source: TradingViewThe losses for the Nasdaq further quickened in May as the benchmark index fell another 9.15% to its lowest level since November 2020.The views and opinions expressed here are solely those of the author and do not necessarily reflect the views of Cointelegraph.com. Every investment and trading move involves risk, you should conduct your own research when making a decision.

Čítaj viac

Terra contagion leads to 80%+ decline in DeFi protocols associated with UST

The knock-on effect of the collapse of Terra (LUNA) and its TerraUSD (UST) stablecoin have spread wide across the cryptocurrency market on May 11 as projects with any kind of association with the DeFi ecosystem have seen their prices hammered. The forced selling of the Bitcoin (BTC) holdings backing a portion of UST also influenced BTC’s current drop to $29,000 and analysts fear that DeFi platforms that have liquidity pools primarily comprised of UST and LUNA will collapse. LUNA, ANC, ASTRO and MARS in USDT pairings. 4-hour chart. Source: TradingViewTerra-based protocols sufferProjects with the direst of outlooks are those that are hosted on the Terra protocol including Anchor Protocol (ANC), Astroport (ASTRO) and Mars Protocol (MARS). As shown in the chart above, Anchor Protocol (ANC), Astroport (ASTRO) and Mars Protocol (MARS) saw their token prices plummet more than 80% since May 4 when LUNA price first started to correct.The protocols in question are all DeFi-focused, meaning that they had heavy integration with UST as the main stablecoin for their liquidity pairs as well as LUNA as a major source of value locked on their smart contracts. As long as UST remains off its $1 peg and LUNA trades down 98% from where it was just 7 days ago, it is unlikely that these protocols will be able to bounce back and recover from today’s fallout. The Interblockchain Communication Protocol also took a hitAssets in the Cosmos ecosystem were also hard hit by UST’s collapse. ATOM and other tokens like Mirror Protocol (MIR), Osmosis (OSMO) and Kava that utilize the Interblockchain Communication Protocol (IBC) corrected sharply due to their integration with Terra.ATOM/USDT vs. KAVA/USDT vs. MIR/USDT vs. OSMO/USDT 4-hour chart. Source: TradingViewThe price declines for these assets was less extreme that those hosted on the Terra protocol, but their proxy to Terra has not protected them from contagion. Related: LUNA meltdown sparks theories and told-you-sos from crypto communityMaker benefits from the volatilityMaker (MKR) is the one bright spot to emerge in trading on May 11 as crypto traders now find themselves embracing Dai (DAI) as the “best” decentralized stablecoin option in the market. MKR price spiked 124% in trading on May 11, going from a low of $1,025 to an intraday high of $2,299 before settling back down to $1,278.MKR/USDT 4-hour chart. Source: TradingViewAs the market digests the current correction and news of fund and protocol collapses emerge, it will be interesting to see how other stablecoin protocols like Frax Share (FXS), USDD and mStable (MTA) perform and whether or not crypto traders will shy away from these projects for more centralized options. The views and opinions expressed here are solely those of the author and do not necessarily reflect the views of Cointelegraph.com. Every investment and trading move involves risk, you should conduct your own research when making a decision.

Čítaj viac

Altcoins stage a relief rally while Bitcoin traders decide whether to buy the dip

The similarity in price action between the crypto and traditional financial markets remains quite strong on May 10 as traders enjoyed a relief bounce across asset classes following the May 9 rout, which saw Bitcoin (BTC) briefly dip to $29,730.Market downturns typically translate to heavier losses in altcoins due to a variety of factors, including thinly traded assets and low liquidity, but this also translates into larger bounces once a recovery ensues. Daily cryptocurrency market performance. Source: Coin360Several projects notched double-digit gains on May 10, including a 15.75% gain for Maker (MKR), the protocol responsible for issuing the DAI (DAI) stablecoin, which likely benefited from the fallout from Terra (LUNA) and its TerraUSD (UST) stablecoin. Other notable gainers include Persistence (XPRT) and its liquid staking token pSTAKE (PSTAKE), which experienced gains of 16.4% and 39.8% after Binance Labs revealed a strategic investment in the liquid staking platform. Polygon (MATIC) also bounced back with a 14.59% gain. Correlation with traditional markets remainsDespite the widely held belief that the crypto market would act as a hedge to TradFi volatility, the correlation between Bitcoin and the stock market has remained high in 2022. If anything, the volatility usually associated with the cryptocurrency market has begun to rear its ugly head in traditional markets, as evidenced by the price action for the Dow Jones Industrial Average on May 10, which rose more than 500 points only to give back at the time of writing.The Nasdaq and S&P 500 have fared a little better, notching gains of 0.9% and 1.92%, respectively. Further evidence to support a correlation between crypto and traditional markets was provided by Bitcoin analyst Willy Woo, who posted the following chart noting that “Fundamentals [are] taking a back seat to fear driven trading.” BTC/USD 1-week chart vs. SPX 1-week chart. Source: TwitterWilly Woo said, “What I do think is we are not trading BTC, we are trading macro and equities. Right pane is SPX support, which will determine BTC directionality, left pane is the equivalent BTC support.”Related: Michael Saylor assuages investors after market slumps hurts $MSTR, $BTCThe S&P 500 could drop much furtherWhile May 10’s relief rally sent crypto and stock prices higher, market analyst Caleb Franzen posted the following chart warning about a bearish head and shoulders formation on the S&P 500 chart that could result in the loss of another 500 points. SPX/USD 1-day chart. Source: TwitterFranzen said, “Hard to pick downside targets after my $4,000 call got hit, but I think the MOST LIKELY support zone is down around $3,530–$3,590. This is the white resistance range from September–October 2020.”The overall cryptocurrency market cap now stands at $1.444 trillion and Bitcoin’s dominance rate is 41.5%.The views and opinions expressed here are solely those of the author and do not necessarily reflect the views of Cointelegraph.com. Every investment and trading move involves risk, you should conduct your own research when making a decision.

Čítaj viac

Bitcoin retests key $30K support zone as data highlights BTC whale accumulation

Sentiment across the cryptocurrency market plunged even deeper on May 9 as an escalation in the ongoing sell-off intensified with bears pushing Bitcoin (BTC) to $30,334, its lowest price since July 2021. Crypto Fear & Greed Index. Source: Alternative.meMultiple factors like rising interest rates, the end of easy money policies by the Federal Reserve, declining stock prices and concerns related to Terra’s UST stablecoin maintaining its $1 peg are all impacting sentiment within the crypto market. Data from Cointelegraph Markets Pro and TradingView shows that an afternoon of heavy selling on May 9 hammered the price of BTC to a daily low of $30,334 as bulls frantically regrouped to defend the psychologically important $30,000 price level. BTC/USDT 1-day chart. Source: TradingViewHere’s a look at what several analysts are saying about the outlook for Bitcoin moving forward, along with some insight into how BTC whales are reacting to the recent price action. Has a bear market started?The possibility of a strong sell-off was discussed prior to Monday’s move by analyst and pseudonymous Twitter user ‘Nunya Bizniz’, who posted the following chart highlighting a possible zone of capitulation for Bitcoin. BTC/USD 1-week chart. Source: TwitterNunya Bizniz said, “This 8-yr parallel channel has four perfect touches. Will there be another capitulation spike low within the yellow circle, between red and blue, aligning with the prior all-time high?Based on the chart provided, the price of BTC could drop as low as $19,891 if such a scenario played out. One way or another, what comes next for BTC is likely to ripple across the cryptocurrency market as the current streak of losses is nearing record-breaking territory as noted by pseudonymous Twitter user ‘Bitcoin Archive’. #Bitcoin went down 6 weeks in a row for just the second time ever.It has never had 7 red weeks in a row. pic.twitter.com/NNXuQUHQC9— Bitcoin Archive (@BTC_Archive) May 9, 2022Bitcoin price is trading below its 2-year moving averageA more positive take on the recent weakness was offered by crypto analyst Philip Swift, who posted the following chart looking at the BTC price relative to its 2-year moving average (MA). Bitcoin 2-year MA multiplier. Source: Twitter The analyst said, “It’s that time in the cycle again! Price has dropped below the 2yr MA. Accumulate.”Related: Bitcoin price falls to $31K as traders prepare for a ‘rocky’ road and more downsideWhales wallets have been feastingAccording to Twitter crypto analyst Akash, Bitcoin whales have been accumulating through the previous downturns and sideways price action. BTC price vs. wallets holding 10,000 to 100,000 BTC. Source: TwitterAkash said, “Wallets holding 10,000 to 100,000 BTC have been on a buying spree since April 30.”While this data is encouraging on some levels it’s important to remember that there are no guarantees against another trend change or further downside and traders would be wise to assume nothing and take extra care to manage their risk moving forward. The overall cryptocurrency market cap now stands at $1.411 trillion and Bitcoin’s dominance rate is 41.5%.The views and opinions expressed here are solely those of the author and do not necessarily reflect the views of Cointelegraph.com. Every investment and trading move involves risk, you should conduct your own research when making a decision.

Čítaj viac

Získaj BONUS 8 € v Bitcoinoch

nakup bitcoin z karty

Registrácia Binance

Burza Binance

Aktuálne kurzy