Autor Cointelegraph By Jordan Finneseth

Bitcoin is discounted near its ‘realized’ price, but analysts say there’s room for deep downside

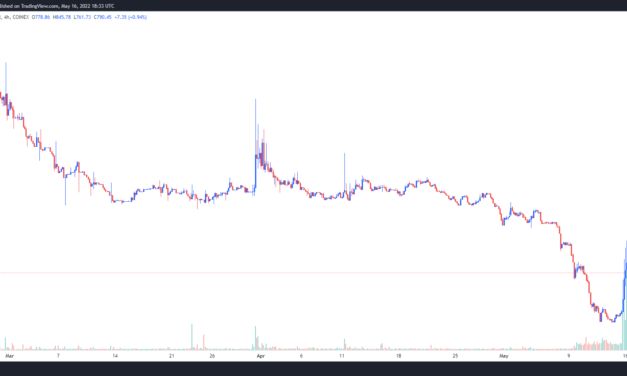
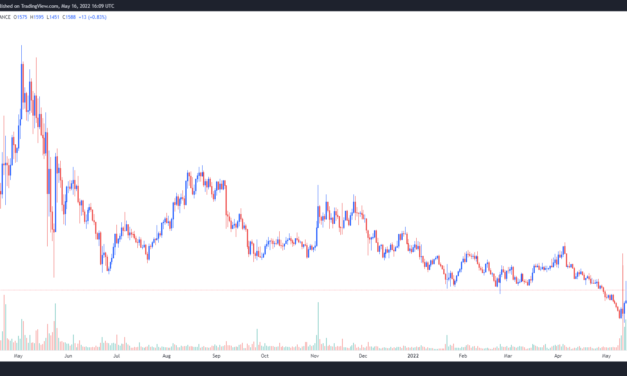
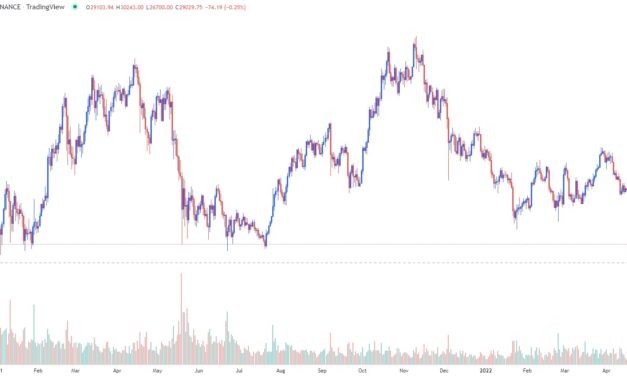
There are early signs of the “dust settling” in the crypto market now that investors believe that the worst of the Terra (LUNA) collapse looks to be over. Viewing Bitcoin’s chart indicates that while the fallout was widespread and quite devastating for altcoins, BItcoin (BTC) has actually held up fairly well. Even with the May 12 drop to $26,697 marking the lowest price level since 2020 multiple metrics suggest that the current levels could represent a good entry to BTC. BTC/USDT 1-day chart. Source: TradingViewThe pullback to this level is notable in that it was a retest of Bitcoin’s 200-week exponential moving average (EMA) at $26,990. According to cryptocurrency research firm Delphi Digital, this metric has historically “served as a key area for prior price bottoms.” BTC/USD vs. 200-week EMA vs. 14-week RSI. Source: Delphi DigitalAnd it wasn’t just Bitcoin that had a rough day on May 12. The stablecoin market also saw its highest level of volatility and deviation from the dollar peg since the start of the Terra saga, with Tether (USDT) experiencing the largest deviation among the major stablecoin projects as shown in the chart below from blockchain data provider Glassnode. Stablecoin prices during Terra’s meltdown. Source: GlassnodeAll four of the top stablecoins by market cap have managed to return to within $0.001 of their dollar peg, but the confidence of crypto holders in their ability to hold has definitely been shaken by the events of the past two weeks. Related: Do Kwon summoned to parliamentary hearing following UST and LUNA crashBitcoin approaches its realized priceAs a result of the market pullback, the price of Bitcoin is now trading the closest it has been to its realized price since 2020. Bitcoin realized price. Source: GlassnodeAccording to Glassnode, the realized price has historically “provided sound support during bear markets and has provided signals of market bottom formation when the market price trades below it.” Previous bear markets saw the price of BTC trade below its realized price for extended periods of time, but the amount of time has actually decreased every cycle with Bitcoin only spending seven days below its realized price during the bear market of 2019–2020. Days Bitcoin spent below its realized price during previous bear markets. Source: GlassnodeIt remains to be seen if BTC will fall below the realized price should the current bear market conditions persist, and if so, how long it will last. On-chain data shows that many crypto holders couldn’t resist the temptation of acquiring Bitcoin below $30,000, resulting in a spike in accumulation beginning on May 12 and continuing through May 15, but some analysts caution against taking this as a sign that a rapid recovery will occur from here. If history is any indication, most #BTC Bear Market bottoms form quickly, in a volatile manner But the accumulation ranges that form afterwards take timeChances are there will be sufficient time to accumulate at deeply discounted prices$BTC #Crypto #Bitcoin— Rekt Capital (@rektcapital) May 13, 2022This sentiment was echoed by Delphi Digital, which noted that “the longer we see price build in these areas, further continuation becomes more likely.”Delphi Digital said, “In the event this happens, look for the following levels: 1) Weekly structure and volume structure support at $22,000–$24,000; 2) 2017 all-time high retests of $19,000–$20,000.”The views and opinions expressed here are solely those of the author and do not necessarily reflect the views of Cointelegraph.com. Every investment and trading move involves risk, you should conduct your own research when making a decision.

Čítaj viac

BIFI gains 100%+ after Beefy Finance adds new vaults and stablecoin liquidity pools

Winston Churchill’s statement to “never let a crisis go to waste” can be applied across many aspects of society, including the recent carnage seen in the crypto market. Last week’s volatility is likely to have newer investors and those who took on heavy losses questioning the future of the burgeoning asset class, but in every bear trend there is a silver lining.One platform that appears to be capitalizing on the void created by TerraUSD’s (UST) collapse is Beefy Finance (BIFI), a multi-chain yield optimizing decentralized finance protocol.Data from Cointelegraph Markets Pro and TradingView shows that after hitting a low of $387.80 on May 14, BIFI spiked 168.13% to hit a daily high of $1,040 on May 16 amidst a 684% increase in its 24-hour trading volume. BIFI/USDT 4-hour chart. Source: TradingViewThree reasons for the sudden spike in activity for BIFI include an increase in the liquidity pool options available yield farming, a new integration with Oasis Networkand the launch of 12 new vaults. Stablecoin yields get a notable boostThe collapse of Terra (LUNA), UST and the 20% yield offered for UST deposits on Anchor Protocol (ANC) has opened the door for protocols like Beefy Finance to capture users and funds that were set adrift. Beefy Finance has taken advantage of this opportunity by upgrading several stablecoin vaults to offer higher yields including the Curve stablecoin liquidity pool on Arbitrum which now offers a yield of 34.9%.Upgraded #Curve #stablecoin lp now on Beefy’s #Arbitrum network. ✅ $USDC – $USDT LP: 34.9% APYhttps://t.co/zdB9WKfQ9B pic.twitter.com/eq0cbZFhmx— Beefy (@beefyfinance) May 16, 2022The platform has also integrated the Tron network’s USDD stablecoin and depositors can earn 62.5% APY on the quad stablecoin pool comprised of USDD/BUSD/USDT/USDC. Beefy Finance expands its ecosystemAs the cryptocurrency ecosystem slowly progresses toward a multi-chain future, Beefy Finance has also benefited from expanding the list of networks the protocol supports and the most recent addition of the Oasis Network brings the total number of supported chains supported to 15. Take a break from staring at your portfolio and TA charts for a moment to read about Beefy’s new partner, @OasisProtocol. We are proud to build on Oasis’s privacy-enabled network. https://t.co/vyL6ludxwq— Beefy (@beefyfinance) May 14, 2022

The integration with the Oasis Network makes Beefy Finance one of the most cross-chain compatible DeFi protocols in the ecosystem and includes support for the most active blockchains including Ethereum (ETH), BNB Smart Chain, Polygon (MATIC), Avalanche (AVAX) and Fantom (FTM). Related: Deus Finance’s dollar-pegged stablecoin DEI falls below 60 centsNew vaults attract fresh liquidityA third factor attracting investors to Beefy Finance is the launch of 12 new vaults within the last week.The new vaults include support for assets from Stader.Fantom, an Oasis-based DeFi protocol called YuzuSwap, the Aurora-based protocol Trisolaris and Step.App (FITFI), which operates on Avalanche.While the price of BIFI has managed to rally higher over the past week, it remains to be seen in if the gains can hold and whether or not the platform will continue to see a rising TVL, especially if the current attractive yields begin to diminish. The views and opinions expressed here are solely those of the author and do not necessarily reflect the views of Cointelegraph.com. Every investment and trading move involves risk, you should conduct your own research when making a decision.

Čítaj viac

MakerDAO price rebounds as DAI holds its peg and investors search for stablecoin security

Its been a rough couple of weeks for the cryptocurrency market. Bitcoin (BTC) price is nowhere near the price estimates of most analysts, multiple stablecoins lost their peg and the demise of one of the top decentralized finance (DeFi) platforms sparked an event that resulted in $900 billion vanishing from the total crypto market capitalization. In the midst of the widespread fallout, MakerDAO (MKR) managed to turn crisis into opportunity and the collapse of TerraUSD (UST) has brought renewed attention to DAI, the longest-running decentralized stablecoin.Data from Cointelegraph Markets Pro and TradingView shows that as the collapse of Terra (LUNA) price accelerated from May 9 to May 12, MKR climbed 66.2% from a low of $952 on May 12 to its current value of $1,587. MKR/USDT 1-day chart. Source: TradingViewThree possible reasons for the MKR’s reversal in momentum include DAI maintaining its peg during the recent market turmoil, the use of a MakerDAO vault to finance supply chain shipments and the addition of staked Ether (ETH) as a form of collateral to mint DAI. DAI holds steady during strong market turbulenceOne of the most significant factors giving investors more confidence in the MakerDAO ecosystem is the fact that DAI held its dollar peg during a shaky market that saw a handful of the most popular stablecoins lose their pegs.Over the past few days DAI demand has violently contracted by 25%, but the peg is still rock solid due to the Peg Stability Modules.Stacking DAI demand into the PSMs during the bull market gives DAI holders peace of mind during even the roughest of weeks. pic.twitter.com/XGEYndBP05— hexonaut.eth @ Permissionless (@hexonaut) May 12, 2022During the height of volatility, the price of DAI oscillated from a low of $0.9961 on May 11 to a high of $1.0046 on May 12 and is currently priced at $0.9994. DAI holding steady despite a supply decrease of more than 2.2 billion DAI may have given investors more confidence, especially after Tether (USDT) briefly saw its price hit a low of $0.9704.Real-world adoption continuesAnother factor providing a boost to MKR is its growing real world adoption. Recently, the MakerDAO vault was used to finance a shipment of Australian beef and additional “use cases” are being planned.A Maker Vault was used to finance a shipment of Australian Beef from Brisbane to Hong Kong.On top of that, the entire operation is currently being tracked using @Mastercard Provenance, a blockchain traceability solution.This is how it was possible— Maker (@MakerDAO) May 10, 2022

On May 9, a MakerDAO vault was utilized in conjunction with the decentralized asset financing protocol Centrifuge to allow the trade finance provider ConsolFreight to mint DAI that was used to finance the transaction. A nonfungible token (NFT) that contained the shipment and invoice data was also minted in the process for tracking purposes and to help keep a record of the transaction. The shipment is also being tracked using Provenance, Mastercard’s blockchain traceability solution. This transaction helped to demonstrate one application of smart contracts and stablecoins in the supply chain industry. Staked Ether as collateralAnother factor building momentum for MakerDAO is the addition of support for staked Ether as a form of collateral on the protocol. sETH2 allows those participating in staking on the Ethereum BNB Chain to gain access to funds that would be otherwise locked up for an unknown amount of time and put them to use earning a yield in DeFi. The collapse of UST, its knock-on effects and the addition of Ether as collateral positions MakerDAO as the top-ranked DeFi protocol by total value locked (TVL), according to data from Defi Llama. Top-5 protocols by total value locked. Source: Defi LlamaMakerDAO claiming the top spot comes after Curve, another popular stablecoin liquidity protocol, saw its TVL fall from $19.32 billion on May 5 to $8.71 billion on May 16. The views and opinions expressed here are solely those of the author and do not necessarily reflect the views of Cointelegraph.com. Every investment and trading move involves risk, you should conduct your own research when making a decision.

Čítaj viac

Bitcoin price could bounce to $35K, but analysts say don’t expect a ‘V-shaped recovery’

Altcoins saw a relief bounce on May 13 as the initial panic sparked by Bitcoin’s sell-off Terra’s UST collapse and multiple stablecoins losing their dollar peg begins to decrease and risk loving traders look to scoop up assets trading at yearly lows.Daily cryptocurrency market performance. Source: Coin360Despite the significant correction that occurred over the past week, Bitcoin (BTC) bulls have managed to claw their way back to the $30,000 zone, a level which has been defended multiple times during the 2021 bull market. Here’s a look at what several analysts have to say about the outlook for Bitcoin moving forward as the price attempts to recover in the face of multiple headwinds.Is a short squeeze pending?Insight into the minds of derivatives traders was provided by cryptocurrency analytics platform Coinalyze, which assessed Bitcoin long to short positions for BTC/USD perpetual contracts on ByBit. BTC/USD perp 1-day chart vs. long/short BTC/USD accounts ratio. Source: TwitterAs shown in the lower half of the chart above, the interest in shorts, which is represented in red, has surged during the recent market downturn indicating that derivatives traders expected more downside in the short term. “The sentiment was very negative over the last few days, as seen in ByBit long/short ratio and funding rate. A short squeeze/bounce is expected” Coinalyze founder Gabriel Dodan told Cointelegraph in private comments. A short-term breakout to $35K is expectedBitcoin’s dip to $26,716 on May 12 was notable in that it broke below the May 2021 low at $28,600, “which was seen as the last man standing for BTC” according to David Lifchitz, managing partner and chief investment officer at ExoAlpha.In Lifchitz’s view, the bounce seen on May 13 was to be expected as “a lot of bad news had been flushed out” while the “panic move from the UST fiasco has already occurred.” Bitcoin sitting at the May 2021 lows “seems like a good entry point here with a tight stop should the purge continue” according to Lifchitz, but traders shouldn’t expect a return to $60,000 to happen overnight and instead should set a more modest short term target of $35,000. Lifchitz said, “Long at $28.5K / Stop at $26.5K / Profit Target at $34.5K = $6K upside / $2K downside = 3/1 win/loss ratio and from an investment point of view, it looks compelling to me.”Related: Buy the dip, or wait for max pain? Analysts debate whether Bitcoin price has bottomedA V-shaped recovery is unlikelyInsight into what it would take for Bitcoin to regain its bullish momentum was provided by market analyst and pseudonymous Twitter user ‘Rekt Capital’, who posted the following chart noting that BTC “needs to keep $28,600 as support for the price to challenge $32,000,” while a “weekly close below the green would be bearish.”BTC/USD 1-week chart. Source: TwitterWhile many optimistic traders are hoping for a rapid recovery from this latest downturn, Rekt Capital warned that “by standards of history, a sharp V-Shaped recovery to mark out a generational bottom is less likely.”The analyst said, “Many expect one as the previous March 2020 BTC bear market bottom was very volatile. But macro price history suggests extended ranges are more likely.”The overall cryptocurrency market cap now stands at $1.287 trillion and Bitcoin’s dominance rate is 44.4%.The views and opinions expressed here are solely those of the author and do not necessarily reflect the views of Cointelegraph.com. Every investment and trading move involves risk, you should conduct your own research when making a decision.

Čítaj viac

Buy the dip, or wait for max pain? Analysts debate whether Bitcoin price has bottomed

It has been a rough week for the cryptocurrency market, primarily because of the Terra ecosystem collapse and its knock-on effect on Bitcoin (BTC), Ethereum (ETH) and altcoin prices, plus the panic selling that took place after stablecoins lost their peg to the U.S. dollar.The bearish headwinds for the crypto market have been building since late 2021 as the U.S. dollar gained strength and the United States Federal Reserve hinted that it would raise interest rates throughout the year.According to a recent report from Delphi Digital, the 14-month RSI for the DXY has now “crossed above 70 for the first time since its late 2014 to 2016 run up.” DXY index performance. Source: Delphi DigitalThis is notable because 11 out of the 14 instances where this previously occurred “led to a stronger dollar ~78% of the time over the following 12 months,” which points to the possibility that the pain for assets could get worse. On average, the DXY gained roughly 5.7% after its RSI rose above 70, which from May 13’s reading “would put the DXY Index just shy of 111, its highest level since 2002.”BTC/USD vs. DXY Index (inverted) and a rolling 60-day correlation. Source: Delphi DigitalDelphi Digital said, “Assuming the correlation between the DXY and BTC remains relatively strong, this would not be welcoming news for the crypto market.”Bitcoin is at a key area for price bottomsTaking a bigger picture approach, BTC is now retesting its 200-week exponential moving average (EMA) near $26,990, which has “historically served as a key area for price bottoms” according to Delphi Digital. BTC/USD vs. 200-week EMA vs. 14-week RSI. Source: Delphi DigitalBitcoin is also continuing to hold above its long-term weekly support range of $28,000 to $30,000, which has proven to be a strong area of support throughout the recent market turmoil. While many traders have been panic selling in recent days, Pantera Capital CEO Dan Morehead has taken a contrarian approach, noting, “It’s best to buy when [the] price is well below trend. Now is one of those times.”Bitcoin fund inflows relative to price trend. Source: TwitterMorehead said, “Bitcoin has been this “cheap” or cheaper relative to trend only 5% of time since Dec 2010. If you have the emotional and financial resources, go the other way.”A word of caution was offered by Delphi Digital, however, which noted that “the best opportunities or “deals” in the market are not around for long.”Since BTC has been trading in the $28,000 to $30,000 range for an extended period of time, “the longer we see price build in these areas, further continuation becomes more likely.”If further decline occurs, the “weekly structure and volume structure support at $22,000 to $24,000” and the “2017 all-time high retests of $19,000 to $24,000” are the next major areas of support. Delphi Digital said, “Early signs of capitulation are starting to bleed through, but we can’t say we’re nearing the point of max pain just yet.”The views and opinions expressed here are solely those of the author and do not necessarily reflect the views of Cointelegraph.com. Every investment and trading move involves risk, you should conduct your own research when making a decision.

Čítaj viac

Získaj BONUS 8 € v Bitcoinoch

nakup bitcoin z karty

Registrácia Binance

Burza Binance

Aktuálne kurzy