Autor Cointelegraph By Jordan Finneseth

3 metrics contrarian crypto investors use to know when to buy Bitcoin

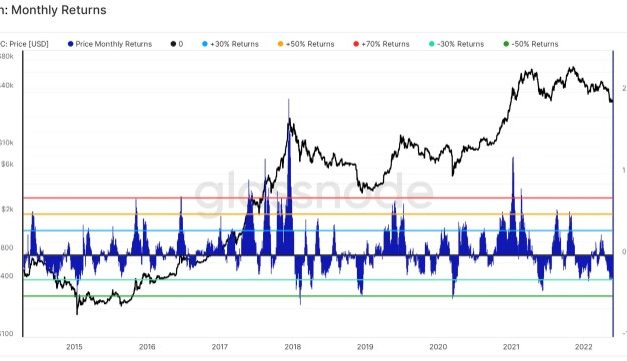
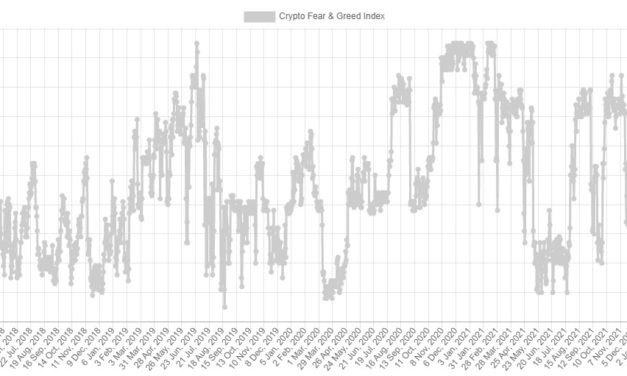
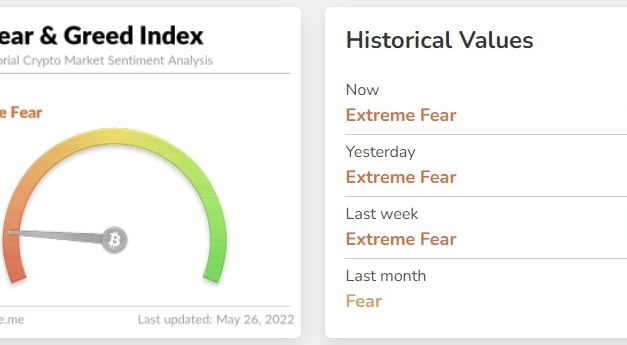
Buying low and selling high is easier said than done, especially when emotion and volatile markets are thrown into the mix. Historically speaking, the best deals are to be found when there is “blood on the streets,” but the danger of catching a falling knife usually keeps most investors planted on the sidelines.The month of May has been especially challenging for crypto holders because Bitcoin (BTC) dropped to a low of $26,782, and some analysts are now predicting a sub-$20,000 BTC price in the near future. It’s times like these when fear is running rampant that the contrarian investor looks to establish positions in promising assets before the broader market comes to its senses. Here’s a look at several indicators that contrarian-minded investors can use to spot opportune moments for opening positions ahead of the next marketwide rally.The Crypto Fear & Greed IndexThe Crypto Fear & Greed index is a well-known measure of market sentiment that most investors use to crowd-forecast the near future of the market. If viewed purely at face value, an “extreme fear” reading, such as the current sentiment, is meant to signal to stay out of the market and preserve capital.Crypto Fear & Greed Index. Source: AlternativeThe index can actually be used as a market indicator, a point noted by analysts at the cryptocurrency intelligence firm Jarvis Labs.One of the biggest factors that can help the index rise is an increase in price. Jarvis Labs backtested the idea of buying when the index falls below a certain threshold and then selling when it reaches a predetermined high. For this test, an index score of 10 was chosen for the low threshold, while scores of 35, 50 and 65 were chosen as sell points. Fear & Greed returns for BTC. Source: Jarvis LabsWhen this method was backtested, results showed that the shorter time-frame option of selling once the index surpassed 35, as represented by the yellow line in the chart above, provided the best results. This method provided an annual average return of 14.6% and a cumulative return of 133.4%. On May 10, the index hit 10 and continued to register a score of 10 or below on six of the 17 days that followed, with the lowest score of 8 happening on May 17. While it’s possible the market will still head lower in the near term, history indicates that both the price and the index will eventually rise above their current levels, presenting a potential investment opportunity for contrarian traders. Whale wallet accumulationFollowing Bitcoin whale wallets with a balance of 10,000 BTC or more is another indicator that signals when buying opportunities arise.Number of Bitcoin addresses with a balance of at least 10,000 BTC. Source: GlassnodeA close look at the past three months shows that while the market has been selling off, the number of wallets holding at least 10,000 BTC has been climbing. Number of Bitcoin addresses with a balance of at least 10,000 BTC. Source: GlassnodeThe number of whale wallets of this size is now at its highest level since February 2021, when Bitcoin was trading above $57,000, and these wallets were selling into strength near the market top. While many analysts on Crypto Twitter are calling for another 30-plus percent drop in the price of BTC, whale wallets are betting on a positive future. Related: 3 reasons why Bitcoin is regaining its crypto market dominanceSome traders buy when Bitcoin price drops below its cost of productionAnother metric that can provide insight into when and where to buy is Bitcoin’s average mining cost, which is the amount of money it costs a miner to mine 1 BTC. Bitcoin average mining cost. Source: MacroMicroAs seen on the chart above, the price of Bitcoin has traded at or above the cost of production for a majority of the time since 2017, indicating that the metric is a good indicator of when generational purchasing opportunities arise.A closer look at the current reading shows that the average mining cost sits at $27,644, around $2,000 below where BTC is trading at the time of writing.Bitcoin average mining cost. Source: MacroMicroFurther analysis shows that in past instances where the market price of BTC fell below the average mining cost, it tended to stay within 10% of the cost to mine and generally managed to regain parity within a couple of months. Bitcoin mining difficulty also recently hit a new all-time high, and the market continues to see an uptrend as more industrial-sized mining operations come online. This means it’s unlikely that the average cost to mine will see a significant decline anytime soon. Taken all together, the current cost to mine as compared with the market price of BTC presents a compelling case for the contrarian investor that the widespread fear dominating the market presents an opportunity to be greedy when others are fearful. Want more information about trading and investing in crypto markets?The views and opinions expressed here are solely those of the author and do not necessarily reflect the views of Cointelegraph.com. Every investment and trading move involves risk, you should conduct your own research when making a decision.

Čítaj viac

On-chain data flashes Bitcoin buy signals, but the bottom could be under $20K

Every Bitcoin investor is searching for signals that the market is approaching a bottom, but the price action of this week suggests that we’re just not there yet. Evidence of this can be found by looking at the monthly return for Bitcoin (BTC), which was hit with a rapid decline that “translated to one of the biggest drawdowns in monthly returns for the asset class in its history” according to the most recent Blockware Solutions Market Intelligence Newsletter. Bitcoin monthly returns. Source: Blockware SolutionsBitcoin continues to trade within an increasingly narrow trading range that is slowly being compressed to the downside as global economic strains mount. Whether or not the price continues to trend lower is a popular topic of debate among crypto analysts and the dominant opinion current points to further downside. Analysts will stay bearish until $45,000 is reclaimedAccording to Blockware Solutions, there are a variety of indicators that point to a bearish outlook as long as BTC trades below the $45,000 to $47,000 dollar range.This includes the fact that Bitcoin started off 2022 at $46,200 while the 180-week exponential hull moving average, which gives more weight to recent price action, indicates that the moment for BTC is declining and currently sits at $47,166. BTC/USD vs. 180-week exponential hull moving average 1-week chart. Source: Blockware SolutionsShort-term hodlers, defined as those who have been in the market for less than 155 days, have been especially hard hit by the market weakness with the current short-term holder cost basis sitting at $45,038. Taken together, these data points suggest that the sentiment for BTC will remain bearish as long as the price is under $45,000. Related: Bitcoin price approaches key support levels to avoid ‘cascade south’Where’s the bottom?Despite the current doom and gloom analysis, there are a few signs that the market may be in the process of searching for a bottom. According to the most recent Glassnode Uncharted newsletter, following the early May drop below $30,000 for Bitcoin, “network activity increased as more supply changed hands while the network shed value.” Bitcoin entity-adjusted NVT. Source: UnchartedAccording to Glassnode, “This phenomenon has historically signaled a great buying opportunity.”To further support the claim that Bitcoin is currently in a good buy zone, the report pointed to the entity-adjusted dormancy flow, which has been consolidating within an area that has previously been considered a optimal purchase zone. Bitcoin entity-adjusted dormancy flow vs. Bitcoin entity-adjusted dormancy. Source: UnchartedBlockware Solutions, likewise, sees several data points that suggest the market may be in search of a bottom, including the Mayer Multiple, a metric that compares the current market price to the 200–day moving average, which is currently “near some of the lowest readings on record.”Bitcoin Mayer Multiple. Source: Blockware SolutionsWhile multiple data points confirm that the crypto market is in a bear market, there are indications that seller exhaustion may be reaching its limit and that the market i searching for a bottom. Where that will eventually be found remains unknown, but several indicators currently point to a solid level of support near the $21,000 level.The views and opinions expressed here are solely those of the author and do not necessarily reflect the views of Cointelegraph.com. Every investment and trading move involves risk, you should conduct your own research when making a decision.

Čítaj viac

WEMIX gains 200%+ after stablecoin and boosted staking rewards announcement

Blockchain-based gaming, also known as GameFi, is an up-and-coming sector that could potentially be one of the primary catalysts for kickstarting the mass adoption of blockchain technology.WEMIX, a gaming protocol that operates on the Klaytn network, aims to get in on the GameFi revolution and this week, the project’s native token (WEMIX) rallied even as the wider market continued to sell-off.Data from Cointelegraph Markets Pro and TradingView shows that since hitting a low of $1.27 on May 12, WEMIX price climbed 269% to hit a daily high at $4.70 on May 25 as its 24-hour trading volume increased to $652 million. WEMIX/USDT 1-day chart. Source: TradingViewThree reasons for the price reversal for WEMIX are the upcoming launch of WEMIX 3.0, a series of project launches and partnership agreements, and the introduction of lockup staking for token holders. WEMIX 3.0The main development attracting attention to WEMIX is the protocol’s planned mainnet launch, which is scheduled to take place on June 15. WEMIX 3.0 will be an Ethereum virtual machine (EVM) compatible public chain that will utilize a stake-based proof-of-authority (SPoA) consensus algorithm. As part of the mainnet launch, WEMIX will also be introducing the WEMIX Dollar (WEMIX) as the native stablecoin of the ecosystem. WEMIX will be a 100% collateralized stablecoin, backed by USD Coin (USDC) and off-chain assets like fiat currencies. New partnerships boost excitementMay has been a busy month for the WEMIX protocol after multiple games launched or announced their upcoming launch dates on the network. New additions include Crypto Ball Z, Four Gods and Every Farm, as well as the onboarding of the SpoLive sports prediction game. Along with protocol launches, WEMIX announced several strategic investments including being the lead investor in the Old Fashion Research (OFR) crypto fund as well as an investment in an U.S.-based augmented reality metaverse startup called Jadu. On May 17, the team behind WEMIX also signed a memorandum of understanding with the Vietnam Blockchain Association. Related: Former Binance executives launch $100 million venture fundIncreased staking rewardsWEMIX also launched Stake360, an incentive that offers WEMIX holders boosted staking rewards for committing to an extended lockup period.#WEMIX #Lockup #Staking 「Stake360」 Notice❓What is #Stake360?- Stake360 is 90 days/180 days/270 days/ 360 days maturity reward staking service.Details of #Maturity #reward, #Heritage system, and Token #Airdrop is provided below : https://t.co/ceeAxW1Z2f pic.twitter.com/u973uVvC6Z— WEMIX (@WemixNetwork) May 19, 2022In addition to the standard 7% staking reward available to all token holders, investors who agree to a 90 to 360 day lockup can earn from 9% to 20.28%.The views and opinions expressed here are solely those of the author and do not necessarily reflect the views of Cointelegraph.com. Every investment and trading move involves risk, you should conduct your own research when making a decision.

Čítaj viac

Falling wedge pattern points to eventual Ethereum price reversal, but traders expect more pain first

The cryptocurrency market was hit with another round of selling on May 26 as Bitcoin (BTC) price dropped to $28,000 and Ether (ETH) briefly fell under $1,800. The ETH/BTC pair also dropped below what traders deem to be an important ascending trendline, a move that traders say could result in Ether price correcting to new lows.ETH/USDT 1-day chart. Source: TradingViewHere’s a rundown of what several analysts in the market are saying about the move lower for Ethereum and what it could mean for its price in the near term. Price consolidation will eventually result in a sharp moveA brief check-in on what levels of support and resistance to keep an eye on was provided by independent market analyst Michaël van de Poppe, who posted the following chart showing Ether trading near its range low. ETH/USD 1-hour chart. Source: TwitterVan de Poppe said, “The question will be whether we can bounce from here and break the $1,940 level. If that happens, I’m assuming we’ll continue $2,050. If it doesn’t, then the markets are looking at $1,800 probably.”ETH could make new lows into a bullish falling wedgeAccording to Twitter analyst Crypto Tony, Ether price is “still looking for that leg down to load up on.”ETH/USDT 4-hour chart. Source: TwitterWhile it might look negative, this development is actually a positive sign, according to Cointelegraph contributor Jon Morgan, who noted that the pattern outlined on this chart is a falling wedge, a “bullish standard candlestick/bar chart pattern that is indicative of a market that has moved to an extreme and is likely to reverse.”Morgan said,“Very high expectancy rate of creating either a violent corrective move higher or an entirely new uptrend.”Related: Ethereum price dips below the $1.8K support as bears prepare for Friday’s $1B options expiryBitcoin dominance risesETH/BTC 1-day chart. Source: TwitterAccording to economist Caleb Franzen, the ETH/BTC pair lost a key support and this is notable because:“This means that at least one of these statements will be true: $ETH is weakening relative to $BTC; $BTC will outperform $ETH; Alts will underperform $BTC.”Adding to the ETH/BTC discussion, Twitter user CrediBULL Crypto  noted that the price is “starting to take some of our local lows.”ETH/BTC 3-day chart. Source: TwitterThe analyst said, “Any relief here is temporary until we traverse to the bottom of this range, imo. In fact, we may head even lower than pictured here before staging a recovery, but will assess once we hit my target.”In general, continued weakness with the ETH/BTC pair has the potential to result in the price of Ether and altcoins trending lower while BTC could hold at its current price or even head higher as traders rotate out of underperforming positions into Bitcoin. The overall cryptocurrency market cap now stands at $1.235 trillion and Bitcoin’s dominance rate is 46.2%.The views and opinions expressed here are solely those of the author and do not necessarily reflect the views of Cointelegraph.com. Every investment and trading move involves risk, you should conduct your own research when making a decision.

Čítaj viac

‘Extreme fear’ grips Bitcoin price, but analysts point to signs of a potential reversal

The cryptocurrency market settled into a holding pattern on May 25 after traders opted to sit on the sidelines ahead of the midday Federal Open Market Committee (FOMC) meeting where the Federal Reserve signaled that it intends to continue on its path of raising interest rates. According to data from Alternative.me, the Fear and Greed Index seeing its longest run of extreme fear since the market crash in Mach 2020.Crypto Fear & Greed Index. Source: AlternativeData from Cointelegraph Markets Pro and TradingView shows that the price action for Bitcoin (BTC) has continued to compress into an increasingly narrow trading range, but technical analysis indicators are not providing much insight on what direction a possible breakout could take.BTC/USDT 1-day chart. Source: TradingViewHere’s a look at what analysts think could come next for Bitcoin price.Whales accumulate as Bitcoin battles to reclaim $30,000BTC/USDT 15-minute chart. Source: TwitterAccording to market analyst Michaël van de Poppe, “#Bitcoin broke through $29.4K and ran towards the next resistance zone. If we hold $29.4K, we’ll be good towards $32.8K. Finally.”One interesting thing to note at these price levels is that while the predominant sentiment is that of extreme fear, on-chain intelligence firm Santiment pointed out that whale wallets have taken this as an opportunity to accumulate some well-priced BTC. Bitcoin price vs. supply distribution. Source: SantimentSantiment said, “As #Bitcoin continues treading water at $29.6K, the amount of key whale addresses (holding 100 to 1k $BTC) continues rising after the massive dumping from late January. We’ve historically seen a correlation between price & this tier’s address quantity.”Price could still pull back to $22,500A macro perspective on how Bitcoin performs following the appearance of a death cross was offered by pseudonymous Twitter user Rekt Capital, who posted the following chart outlining what to expect if the “historical price tendencies relating to the #BTC Death Cross repeat […]” BTC/USD 1-week chart. Source: TwitterRekt Capital said, “$BTC will breakdown from the Macro Range Low support & continue its drop to complete -43% downside. The -43% mark is confluent with the 200-Week MA at ~$22500.”Related: Scott Minerd says Bitcoin price will drop to $8K, but technical analysis says otherwise“A pivotal retest”The importance of the current price level for Bitcoin was touched upon by economist Caleb Franzen, who posted the following chart looking at the long-term performance of BTC versus its weekly anchored volume-weighted average price (AVWAP) noting that “This is a pivotal retest, similar to the dynamics in March 2022.”BTC/USD vs AVWAP 1-week chart. Source: TwitterFranzen said, “A rebound on the weekly AVWAP from the COVID low could increase bullish probabilities. A breakdown below it would drastically increase bearish probabilities, foreshadowing a retest of the grey range, $13.8k-19.8k.”The overall cryptocurrency market cap now stands at $1.265 trillion and Bitcoin’s dominance rate is 44.8%.The views and opinions expressed here are solely those of the author and do not necessarily reflect the views of Cointelegraph.com. Every investment and trading move involves risk, you should conduct your own research when making a decision.

Čítaj viac

Získaj BONUS 8 € v Bitcoinoch

nakup bitcoin z karty

Registrácia Binance

Burza Binance

Aktuálne kurzy