Autor Cointelegraph By Jordan Finneseth

Ocean Protocol, Helium and Chainlink post monthly gains while Bitcoin price consolidates

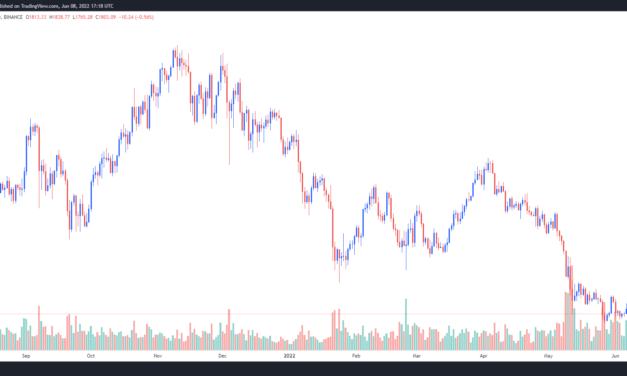
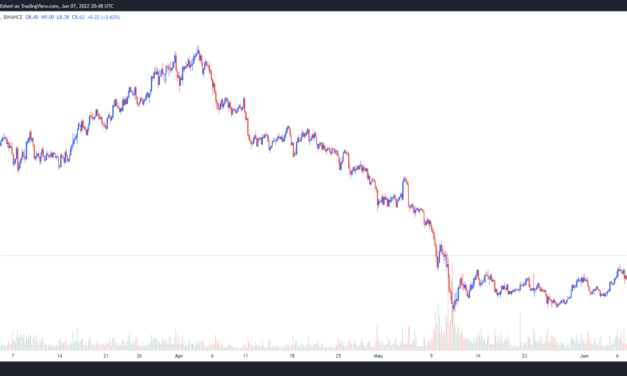
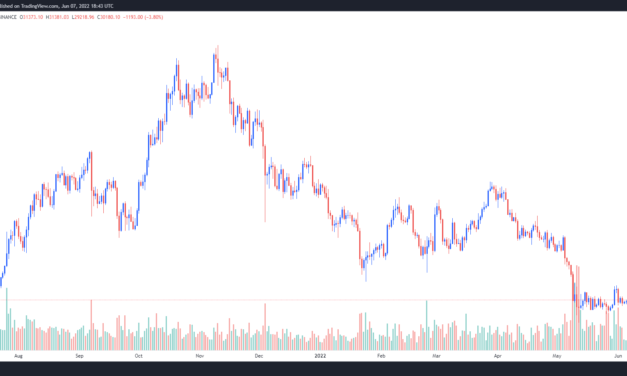
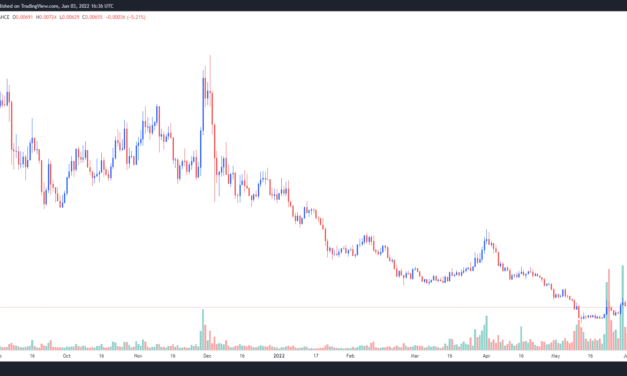
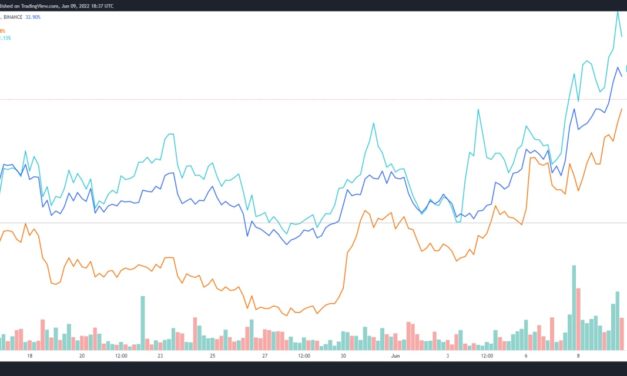
Positive price movements during bear markets are noteworthy primarily because they can help identify projects that have a good chance of surviving until the next bull cycle . Generally, price action in June has been stagnant for a majority of the crypto market because traders are nervous about Bitcoin’s (BTC) oscillation around the $30,000 support level, but there have been a few strong performers. LINK/USDT vs. HNT/USDT vs. OCEAN/USDT 4-hour chart. Source: TradingViewData from Cointelegraph Markets Pro and TradingView shows that three of the biggest gainers in the month of June have been Chainlink (LINK), Ocean Protocol (OCEAN) and Helium (HNT). Chainlink introduces stakingThe Chainlink protocol is the most widely adopted oracle network in the cryptocurrency ecosystem which allows blockchains to securely interact with external data feeds for the proper functioning of smart contracts. Earlier this week, the project revealed a roadmap for the first time and indicated that LINK staking would launch soon. The NewsQuakes™ alert system from Cointelegraph Markets Pro managed to capture the staking announcement for LINK on June 7, prior to the recent price rise.VORTECS™ Score (green) vs. LINK price. Source: Cointelegraph Markets ProAs seen in the chart above, following the NewsQuakes™ alert for LINK which was registered at noon on June 7, the price of LINK proceeded to increase by 29.55% over the next two days. Ocean Protocol introduces data NFTsOcean Protocol’s native OCEAN token also was a strong performer this week and data from Cointelegraph Markets Pro and TradingView shows that since hitting a low of $0.1965 on June 3, the price of OCEAN has rallied 64.53% to hit a daily high at $0.3233 on June 9.OCEAN/USDT 4-hour chart. Source: TradingViewThe climbing price of OCEAN comes after the release of the Ocean ONDA v4 data marketplace which debuted the release of data NFTs that can be used to model the copyright or exclusive license for a data asset. Along with the introduction of data NFTS, the protocol has also introduced Ocean data framing which enables token holders to stake their OCEAN tokens and earn up to 125% APY. Related: Chainlink brings Keepers and VRF to the Avalanche blockchainHelium holders vote to support new networksHelium protocol is a 5G Internet-of-Things-focused project supporting low-powered wireless devices to communicate with each other and send data across its network of nodes.Data from Cointelegraph Markets Pro and TradingView shows that since hitting a low of $6.35 on May 29, the price of HNT has surged 79.14% to hit a daily high of $12.28 on June 9 as its 24-hour trading volume spiked 249% to $126.7 million. HNT/USDT 4-hour chart. Source: TradingViewHNT’s breakout occurred as the Helium community voted on HIP-51, a proposal that covered the economic and technical constructions needed to scale the Helium Network to support new users, devices and different types of networks including cellular, VPN, WiFi and LPWAN. Voters ultimately approved the proposal on June 8, with 96.94% of voters approving the transition to making Helium a “network of networks.”The views and opinions expressed here are solely those of the author and do not necessarily reflect the views of Cointelegraph.com. Every investment and trading move involves risk, you should conduct your own research when making a decision.

Čítaj viac

Traders target $1,400 Ethereum price after ETH drops closer to a critical support level

On June 8 the Ethereum network successfully underwent the merge to become proof-of-stake on its Ropsten testnet, but the news had little impact on ETH price. With the Ropsten upgrade now looking more like a buy the rumor, sell the news type of event, most analysts have kept a short-term bearish outlook for Ether price. Let’s take a look.ETH/USDT 1-day chart. Source: TradingViewCan Ether escape the head and shoulders pattern?Twitter analyst, “Cactus”pointed out a bearish head and shoulders pattern and questioned whether Ether price would be able to follow the sharp downside that typically follows the completion of the pattern.ETH/USD 1-week chart. Source: TwitterCactus said, “This is what we are getting excited about? Hard to be bullish any timeframe until we S/R [support/resistance] flip 2K.”The areas of support to keep an eye on below $1,800 were highlighted in the following chart posted by crypto analyst and pseudonymous Twitter user il Capo of Crypto, who ominously noted that “Lower highs all the time and that support has been touched a lot of times already.”ETH/USD 1-day chart. Source: TwitterThe analyst said, “Clean break of $1,700 and last leg down would be confirmed, with main target = $1,000.” The descending triangle pattern also forecasts further downsideA separate, but equally bearish descending triangle chart pattern was highlighted by Crypto Tony, who pondered if this is “something too obvious” to ignore. ETH/USD 1-day chart. Source: TwitterBased on the lower area of support highlighted on the chart provided by Crypto Tony, a breakdown below the current price could see Ether pullback to the $1,450 to $1,600 range. Related: Ethereum ‘double Doji’ pattern hints at a 50% ETH price rally by SeptemberPrice momentum turns negativeA more macro view of the general weakness being displayed by Ether was offered by cryptocurrency trader Cantering Clark, who said “If I didn’t think that this time was slightly different, I would look at this $ETH chart and think ‘Big ships turn slowly, and they don’t stop easily.’”ETH/USD 1-week chart. Source: TwitterCantering Clark said, “By high timeframe measures, this could be the beginning of actual momentum down.”The views and opinions expressed here are solely those of the author and do not necessarily reflect the views of Cointelegraph.com. Every investment and trading move involves risk, you should conduct your own research when making a decision.

Čítaj viac

LINK marines rejoice after Chainlink 2.0 brings a new roadmap and staking

Passive income opportunities are one of the biggest draws in the cryptocurrency ecosystem because it gives investors an easy opportunity to grow their portfolio size regardless of the day-to-day price action.The latest token to get a bump in its price after announcing the upcoming implementation of staking is Chainlink (LINK), the decentralized oracle network that provides important off-chain information needed for the proper functioning of smart contracts. Data from Cointelegraph Markets Pro and TradingView shows that since bouncing off a low of $6.67 on June 4, the price of LINK has increased 35% to hit a daily high of $9.00 on June 7. LINK/USDT 4-hour chart. Source: TradingViewHere’s a look at what the new developments in the Chainlink ecosystem that could be backing today’s price rally.Staking LINK has been years in the makingThe ability to stake LINK has been a sought-after capability for several years now because Chainlink has consistently been the largest oracle project in the entire cryptocurrency ecosystem. Staking marks the start of #Chainlink Economics 2.0, a new era for the long-term security and sustainability of oracle networks.In this update, we define the long-term goals, roadmap, and initial implementation of staking in the Chainlink Network.https://t.co/WJkoUzPA0i— Chainlink (@chainlink) June 7, 2022According to the announcement released by Chainlink, the overarching goal of staking on the network “is to give ecosystem participants, including node operators and community members, the ability to increase the security guarantees and user assurances of oracle services by backing them with staked LINK tokens.”By staking LINK, the ability for nodes to receive jobs and earn fees on the Chainlink network will be enhanced while the ecosystem as a whole will benefit from an “increase in cryptoeconomic security and user assurances.” Staking not only introduces an incentive to provide reliable data, but it allows for a penalty mechanism for underperforming nodes who fail to achieve the goal of consistently generating accurate oracle reports and delivering them to specific destinations in a timely manner. Greater community participationAnother benefit of introducing staking is that it will help encourage a larger amount of the Chainlink community to get directly involved with the network by staking LINK to support the performance of oracle networks. Getting more individuals involved with community monitoring directly helps to increase the decentralization of the Chainlink network and enables “a robust reputation system and slashing mechanism.”The addition of staking is also expected to increase network adoption over time as new sources of rewards and an increase in the amount of protocol fees that are generated from non-emission-based sources further attracts more participants. Related: Chainlink launches price feeds on Solana to provide data to DeFi developersProof of reservesThe new roadmap also introduces Chainlink Proof of Reserves (PoR). #Chainlink Proof of Reserve (PoR) enables #DeFi projects to verify off-chain and cross-chain asset reserves through automated audits based on cryptographic truth.Learn how PoR helps secure cross-chain assets, stablecoins, wrapped tokens, and more https://t.co/qZRj7oExsz— Chainlink (@chainlink) June 6, 2022

With PoR, the cryptocurrency holdings of a company can be easily audited through an automated process that leverages the transparency of blockchains, smart contracts and oracles. This real-time auditing of collateral helps to ensure that user funds are protected from “unforeseen fractional reserve practices and other fraudulent activity from off-chain custodians.” In doing so, PoR helps to bring a higher degree of transparency to the crypto ecosystem as a whole and it addresses some of the biggest complaints about how the current financial system operates. The views and opinions expressed here are solely those of the author and do not necessarily reflect the views of Cointelegraph.com. Every investment and trading move involves risk, you should conduct your own research when making a decision.

Čítaj viac

Bitcoin price recovers $31.5K, but traders say ‘scam’ price action will bring more downside

Bitcoin’s (BTC) short-term price action has been dominated by whipsaws that trigger around the $31,000 to $32,000 level and the June 6 reversal at this point triggered a quick sell-off that pushed the price down to $29,200. Surprisingly, on June 7, the price rapidly reversed course as Bitcoin rallied back to $31,500, but given the current rejection at this level, traders are likely to proceed cautiously, rather than expect a quick surge to $35,000.BTC/USDT 1-day chart. Source: TradingViewHere’s what several analysts are saying about the short-term outlook for BTC and what support levels to keep an eye on moving forward. A clear redistribution rangeThe range-bound trading currently impacting Bitcoin was addressed by crypto analyst and pseudonymous Twitter user il Capo of Crypto, who posted the following chart highlighting the “clean range” that BTC has been stuck in for nearly a month. BTC/USD 4-hour chart. Source: TwitterThe analyst said, “What is happening inside the range and what has happened at the range high, shows that this is [a] clear redistribution range. Clean break of the range low = last leg down confirmed = 21K–23K.”Ongoing flip-flop price actionA slightly different outcome to the current market chop was suggested by crypto trader and pseudonymous Twitter user Phoenix, who posted the following chart lamenting the month-long range-bound trading for BTC and hinted that it will see more of the same. BTC/USD 2-hour chart. Source: TwitterPhoenix said, “On our way towards a whole month inside a mini-range again to fully deploy the flip-flop-your-bias-non-stop-angry-pleb-and-gtfo. *Ppl fomoed the top, lows taken again after the nuke, up we go again?*”Related: Coinbase balance drops by 30K BTC as Bitcoin price nurses 6% lossesA possible flush out to $20KFor traders trying to get some sense of where the bottom might be, market analyst and pseudonymous Twitter user Rekt Capital posted the following chart highlighting the 200-EMA (exponential moving average) as a key indicator to watch. BTC/USD 1-week chart. Source: TwitterAccording to Rekt Capital, the price history for Bitcoin shows that while it “tends to confirm uptrends when it breaks above the blue 50-week EMA,” on the flip side it “tends to confirm maximum financial opportunity when it reaches and breaks down from the black 200-week EMA.”A closer look at the recent price action around these indicators was provided in the following chart posted by Rekt Capital to provide a better picture of what support level to look out for. BTC/USD 1-week chart. Source: TwitterRekt Capital said, “This area is ~confluent with the orange #BTC 200-week MA. In fact $BTC would need to downside wick below the 200MA to reach the ~$20K area. Interestingly, downside wicking tends to occur below the 200MA to mark out generational bottoms.”The overall cryptocurrency market cap now stands at $1.24 trillion and Bitcoin’s dominance rate is 46.4%.The views and opinions expressed here are solely those of the author and do not necessarily reflect the views of Cointelegraph.com. Every investment and trading move involves risk, you should conduct your own research when making a decision.

Čítaj viac

Reserve Rights (RSR) builds momentum ahead of its long-awaited mainnet launch

Bitcoin was created to give the average person a peer-to-peer economic system and a store of wealth asset that could provide financial autonomy and access to banking, especially for people living in places where financial services are sparse or non-existent.In the last five years, there have been a number of blockchain projects that aim to mirror Bitcoin’s original mission and the growing popularity of stablecoins further highlights the need for alternative financial models. One project that is beginning to see a bit of momentum is Reserve Rights (RSR), a dual-token stablecoin platform comprised of the asset-backed Reserve Stablecoin (RSV) and the RSR token which helps to keep the price of RSV stable through a system of arbitrage opportunities. Data from Cointelegraph Markets Pro and TradingView shows that while the price of RSR has been beaten down along with the wider market over the past few months, the token has recently seen an uptick in trading volume which suggests a possible revival could be underway. RSR/USDT 1-day chart. Source: TradingViewThree reasons for the increase in demand for the RSR token include the upcoming launch of the Reserve Rights mainnet, anticipation for token staking and the ability of RSV to maintain its peg during the recent market-wide volatility. RSR mainnet launchThe biggest upcoming development for Reserve Rights that has its community excited is its August launch its mainnet. Following the launch of Reserve Rights on the Ethereum (ETH) mainnet, the full capabilities of the protocol will be enabled including the ability for anyone to create stablecoins backed by baskets of ERC-20 tokens. Along with being fully collateralized, stablecoins on the protocol (RTokens )can be insured as a way to help protect against collateral devaluation. RTokens are also able to generate revenue for their holders, which is the incentive for RSR holders to stake their RSR on a specific RToken. Revenue for token holders comes from transaction fees, revenue shares with collateral token issuers and the yields from lending collateral tokens on-chain. RSR stakingRSR’s mainnet launch will also activate token staking. For most staking protocols that exist today, the main function is to lock tokens in a smart contract which prevents a holder from selling, but it doesn’t really have any additional function for the ecosystem.Once the full Reserve Protocol has launched on Ethereum mainnet, Reserve Rights (RSR) holders will be able to stake their tokens, thereby insuring & governing the network ⚖️Let us take you through all the details of RSR staking in our latest article https://t.co/hS8rojPo3z— Reserve (@reserveprotocol) May 2, 2022Staking on the Reserve Protocol, in contrast, has a practical use for the protocol because pledging RSR tokens to a specific RToken helps to insure that token against collateral defaults. This means that should any of the collateral tokens default, staked RSR can be seized in order for the RToken to maintain its peg. In exchange for taking this risk, RToken revenue is shared with RSR stakers in order to guarantee sufficient insurance. The yield offered by each RToken will depend on a variety of factors, including the market cap of the RToken, the revenue the token makes, the percentage of the revenue that is shared with RSR stakers and the total amount of RSR staked. Related: Latin America’s largest digital bank will allocate 1% to BTC, offer crypto investment servicesA growing community and successful stablecoinA third factor bringing a boost to RSR is the continued growth of its community and the ability for its RSV stabelcoin to maintain its peg amid the recent market volatility.During the height of the volatility in May when TerraUSD Classic (USTC) was collapsing, the lowest price RSV hit was $0.9923. That means that RSV held up better than a majority of stablecoins in the market.RSV price. Source: CoinGeckoAlong with RSV maintaining its peg, the Reserve Rights community also recently surpassed 600,000 users on the Reserve app, which now provides access to more than 18,000 merchants across Latin America who accept RSV and process a monthly volume in excess of $100 million. The team behind the protocol is also currently working on adding support for users in Mexico, which has the potential to initiate the onboarding of a new cohort of RSV users. The views and opinions expressed here are solely those of the author and do not necessarily reflect the views of Cointelegraph.com. Every investment and trading move involves risk, you should conduct your own research when making a decision.

Čítaj viac

Získaj BONUS 8 € v Bitcoinoch

nakup bitcoin z karty

Registrácia Binance

Burza Binance

Aktuálne kurzy