Autor Cointelegraph By Jon Morgan

Stocks surge, altcoins give back their gains and dollar strength may push Bitcoin lower

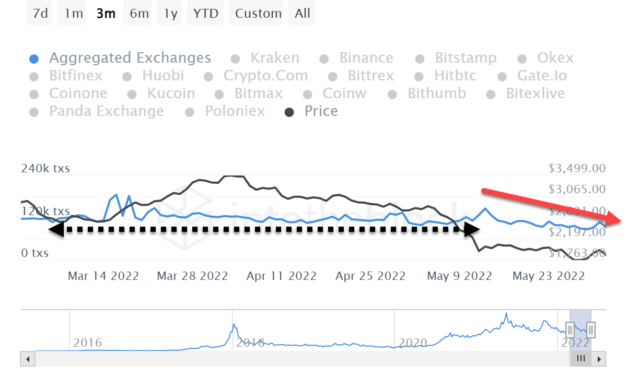
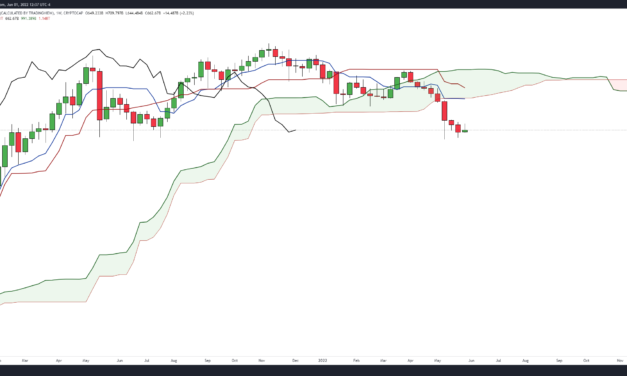
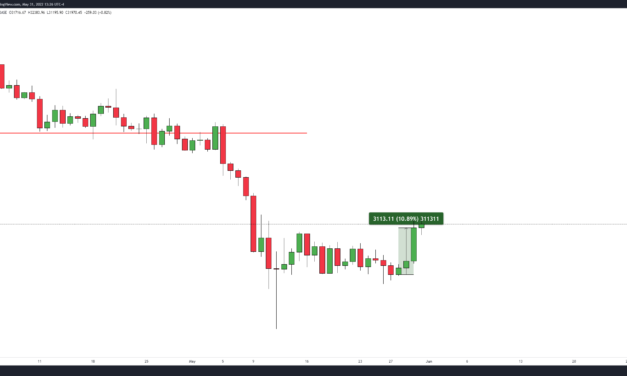
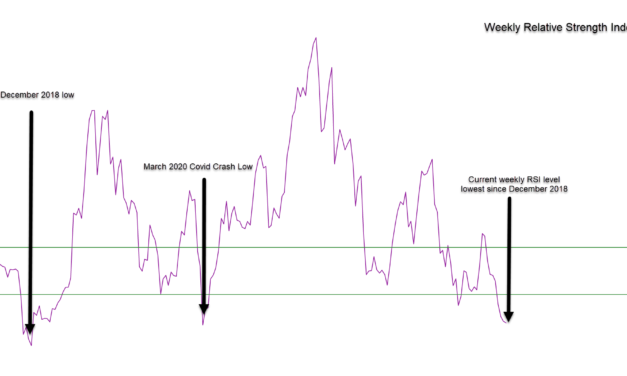
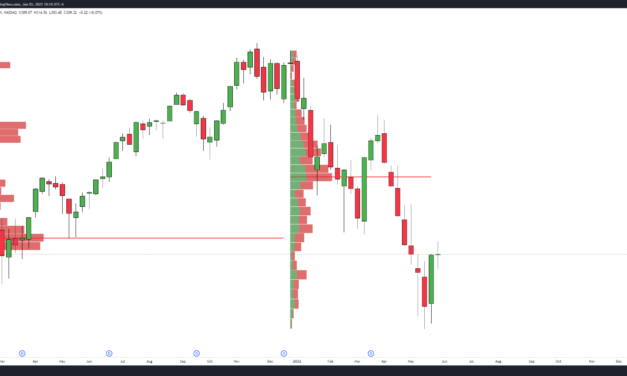
Between May 23 and 27, the equities markets had an impressive run, with the tech-heavy NASDAQ (NASDAQ: QQQ) ETF up over 7% and the S&P 500 (NYSE: SPY) up over 6.50%. However, this week whipsaws in price action occurred throughout the week and while the J trade session is not yet over, the weekly candlesticks suggest a close near last week’s open. QQQ weekly chart (NYSE). Source: TradingViewCurrently, all major indexes face significant technical resistance levels above their present traded levels. Throw in thegrowing economic uncertainty and fears of a recession; the bounce may be limited. Cryptocurrencies down againThe crypto market may close relatively flat but down for the week, extending its losing streak to an all-time high of nine consecutive weekly losses. Some altcoins this week were in the green, Cardano (ADA) and Stellar (XLM), for example, but both saw 50% to 70% of those gains wiped out. Crypto total market capitalization weekly chart. Source: TradingViewThe total market capitalization for the cryptocurrency market stands just above the $1.20 trillion level, which is getting uncomfortably close to the critical $1 trillion zone. Oil continues to riseLight crude futures (NYMEX: CL) continue to rise and could complete an implied close near 14-year highs, levels not seen since late July 2008. From April 11 to June 3, oil has already gained more than 20% and rests just below the $120 level. Oil futures weekly chart (NYMEX). Source: TradingViewThe weekly crude oil inventory data on June 1 showed a massively larger drop of -5 million barrels versus the estimated -1.35 million. Even the recent agreement from OPEC+ to nearly double production has failed to stimy oil’s rise. Food commodities tankWheat futures (CBOT: ZW) and corn futures (CBOT: ZC) are down this week, -10% and -6%, respectively. However, the drop in these markets is most likely due to severely extended overbought conditions, resulting in a technical pullback. Global fears and uncertainty about food security and scarcity continue to plague this market. Wheat futures weekly chart (CBOT). Source: TradingViewDollar recovery may be underwayLike wheat and corn, the greenback is coming off of a technical pullback from extended overbought conditions. As a result, within the Ichimoku Kinko Hyo system, the US Dollar Index (TVC: DXY) has an implied close for the week that is higher with a marginal gain of 0.3%. A strong technical bounce of the weekly Tenkan-Sen saw the DXY bounce more than +1%, but most of those gains have been lost. The DXY could drop lower to the critical 100 level near the weekly Kijun-Sen, but the hidden bullish divergence between the chart and the composite index may prevent further downside pressure. For traders and investors of cryptocurrencies, the DXY is sometimes viewed as a non-correlated market. In other words, when the DXY moves up, Bitcoin (BTC) and altcoins move down. That is not always the case, but the DXY should be viewed as a flight to safety. When money moves into the dollar, it is assumed that market participants are afraid and uncertain. Coupled with continued economic uncertainty and some shakiness in the labor market, the DXY may continue its steady rise higher. Major economic data next week to watchJune 7: Canadian balance of trade and Ivey PMI data. US API Crude oil stock change. June 9: European Union Central Bank interest rate decision. US initial jobless claims.June 10: Canadian unemployment rate. US core inflation (MoM), real inflation rate, core inflation (YoY) and Michigan consumer sentiment.The views and opinions expressed here are solely those of the author and do not necessarily reflect the views of Cointelegraph.com. Every investment and trading move involves risk, you should conduct your own research when making a decision.

Čítaj viac

Ethereum’s Merge FOMO isn’t priced in, making a spike to $2.6K a possibility

In a May 30 tweet, Ethereum (ETH) core developer Tim Beiko confirmed that the much-anticipated switch from proof-of-work to proof-of-stake can be expected “around June 8 or so.”Interestingly, the Ether price action is relatively unchanged despite the unexpected bullish announcement. There was a +10% spike on May 30, but those gains were given back between May 31 and June 2. It is very likely that this event has yet to be priced in, giving traders and investors a possible early entrant advantage. It’s essential to monitor on-chain dataFrom an investing and trading viewpoint, cryptocurrency markets have a distinct disadvantage over-regulated markets and transparency. The stock market is chock-full of legally required disclosures. In the stock market, the retail trader can identify how many shares of a stock are short, what institution bought (or sold) a large disclosed amount, what insiders bought or sold and a myriad of other forms of information. The cryptocurrency markets do not have that kind of legal requirement. In fact, the public doesn’t know if the Bitcoin (BTC) or Ethereum being bought and sold on an exchange is the real cryptocurrency or a type of internal derivative used to facilitate liquidity. But crypto markets have something better than the stock market and that is on-chain data. On-chain data allows investors and traders to monitor a blockchain’s network activity. It can answer questions: How many Ether are being sent to an exchange? Are there any large transactions? Are any “whale” wallets bigger or smaller? On-chain data can help determine whether a trader or investor should be bullish or bearish. On-chain data that measure inflows and outflows is often used to determine a bias of whether a cryptocurrency is bullish or bearish. Inflow measurements are cryptocurrencies entering an exchange from outside wallets and are often perceived as a sign of incoming selling pressure. Outflow measurements are cryptocurrencies exiting an exchange to external wallets and are often perceived as a sign of holding or accumulation. The number of inflow transactions has stayed relatively flat over the past three months, with a noticeable drop since the middle of May.Inflow 24h change: -13.50%Inflow 7-day change: -5.87%Inflow 30-day change: -8.08%Aggregated exchange inflow transaction Count. Source: intotheblockHowever, the number of outflow transactions has declined since March. In addition, there was a major outflow spike on May 12, the date of the most recent Ether flash crash, followed by a resumption of a decline in outflows. Outflow 24h-change: +3.62%Outflow 7-day change: +8.87%Outflow 30-day change: -1.56%Aggregated exchange inflow transaction count. Source: intotheblockIt is important to note that since May 29, outflows have increased and inflows have decreased. This could be a bullish signal that big money is accumulating. Related: 3 key indicators traders use to determine when altcoin season beginsEther price remains at major swing lows and oscillators are at historical lowsThe upcoming Merge event is one of the most significant in Ethereum’s history. It is rare to see the world’s second most valuable cryptocurrency remaining at 200-day lows and down more than 60% from its all-time high. Perhaps the most important and relevant details for Ether are the position of the relative strength index and the composite index. The weekly relative strength index remains in bull market conditions, but is just above the final oversold level of 40. The current value of 42.15 is the lowest since the week of March 18, 2019. The composite index, likewise, is at near a historical low. The composite index, developed by Connie Brown, is essentially the RSI with a momentum indicator. It is an unbounded oscillator and can catch divergences that the RSI cannot. The weekly composite index value is the third lowest in Ethereum’s history and the lowest since the week of March 26, 2018.ETH/USD weekly chart (Coinbase). Source: TradingViewThe extreme oversold readings on the Ether weekly chart, rise in outflows and reduction of inflows can give Ethereum investors and traders a good reason to be bullish in the near term. However, any potential bullish reaction will likely be swift and abrupt, but likely limited to the 2022 volume point of control at $2,600. The views and opinions expressed here are solely those of the author and do not necessarily reflect the views of Cointelegraph.com. Every investment and trading move involves risk, you should conduct your own research when making a decision.

Čítaj viac

Here are 3 altcoins that could surge once Bitcoin flips $35K to support

Bitcoin (BTC) and the wider cryptocurrency market are taking a breather after the rally on May 31. Meanwhile, most altcoins remain severely oversold, with most between 70% and 90% below their all-time highs. Total altcoin index capitalizationWhat’s clear is that fear is everywhere and blood is in the water. Risk-on markets worldwide are suffering, but it is exactly these kinds of conditions that create opportunities where professional money accumulates and adds to positions. Let’s take a look at three altcoins that could be positioned for a rebound if the broader market enters a new uptrend.ADA could be setting up for an 80% surgeCardano (ADA) has a significantly bullish update coming very soon. The much anticipated Vasil hard fork, which increases performance and adds more Plutus enhancements, is planned for June. From a price action perspective, ADA is positioned in a strong price range that will likely support any further upside that the broader market experienced. Within the Ichimoku Kinko Hyo system, ADA has maintained a significant gap between the bodies of the past three weekly candlesticks and the Tenkan-Sen. When the bodies of the candlesticks and the Tenkan-Sen have noticeable gaps, a correction often occurs within three to four days. This is because equilibrium is out of sync, the Tenkan-Sen and price action like to stick together as much as possible. A mean reversion back to the Tenkan-sen is extremely likely when one strays too far from the other. ADA/USD weekly Ichimoku Kinko Hyo chart Source: TradingViewHowever, if the broader cryptocurrency market experiences a big bounce, ADA price may shoot past the Tenkan-Sen to test the Kijun-Sen. ADA has not tested the weekly Kijun-Sen since the week of November 8, 2021. The weekly Kijun-Sen is at $1.02 and contains the 2021 volume point of control and the 50% Fibonacci retracement of the all-time high to the low of January 25, 2021.ADA/USD weekly chart (Binance) Source: TradingViewRelated: Bitcoin may hit $14K in 2022, but buying BTC now ‘as good as it gets:’ AnalystMATIC aims for $1Looking at the weekly chart of Polygon (MATIC), one can’t help but notice that it looks strikingly similar to ADA. MATIC and ADA both have sold off from $3 and both are stuck in the mid $0.50 to mid $0.60 price range, but that is where the similarities mostly end. Fundamentally, MATIC remains strong. Governments worldwide have attempted to restrict or ban mining due to excessive energy costs for proof-of-work blockchains and MATIC is likely to avoid government scrutiny and attract supporters as a positive example of environmental stewardship.Polygon (MATIC) Source: TwitterLike ADA, MATIC has significant gaps between the bodies of its weekly candlesticks and the Tenkan-Sen. Although, MATIC’s gaps are more significant. Likewise, the gap between price and the Kijun-Sen is much more meaningful. Within the Ichimoku Kinko Hyo system, there is a max-mean that price will travel away from the Kijun-Sen before experiencing a violent mean reversion. For MATIC, that threshold is 63%. MATIC/USD weekly chart (Binance) Source: TradingViewAny renewed bullish momentum in for Bitcoin will likely see MATIC lead the altcoins higher until it reaches the $1.00 to $1.15 value area near the weekly Tenkan-Sen. XLM lags the altcoin market, but it’s known for surprisesSometimes it is hard to forget that during the last major bull run from the COVID crash to November 2021, there were a few major altcoins that did not hit new all-time highs. Stellar (XLM) is one of them. In fact, the last time XLM made a new all-time high was the week of January 8, 2018, almost four and a half years ago!One thing that XLM has going for it that not many other weekly charts have is a very clear falling wedge pattern. Out of the standard rectangle and triangle patterns in technical analysis, wedge patterns are the most powerful. What makes its wedge so powerful is the probable fakeout breakout lower.XLM/USD weekly chart (Binance) Source: TradingViewThe most probable direction for a falling wedge is higher — but breakouts below a falling wedge can yield powerful short opportunities. The typical behavior analysts and traders expect to see with a failed falling wedge is an immediate and swift sell-off, but so far, bears have been unable or unwilling to do so. Instead, the weekly chart for XLM shows a very strong probability of a fakeout. If bullish momentum returns to the cryptocurrency market, XLM is likely to hit the second peak of the falling wedge near the $0.38 value area. Classic technical analysts believe that technicals lead fundamentals. If that is true, then altcoins like XLM, MATIC, and ADA could be positioned in very desirable conditions in the event of any new bull run. However, downside risks remain a concern, but they are likely extremely limited. If a new uptrend fails to materialize before the end of June, the cryptocurrency market will probably move sideways until a major breakout higher or lower occurs in the Fall. The views and opinions expressed here are solely those of the author and do not necessarily reflect the views of Cointelegraph.com. Every investment and trading move involves risk, you should conduct your own research when making a decision.

Čítaj viac

Bitcoin price rallies to $32.3K, but three factors could limit its recovery

Bitcoin (BTC) price action has been surprisingly bullish since May 27. Weekends, especially holiday weekends, are notoriously volatile and indecisive, with major whipsaws in price movements being the norm. Even in bull markets, bearish price action is often the norm, but BTC bucked that trend. BTC/USD daily chart (Coinbase) Source: TradingViewBitcoin rallied nearly 11% between May 27 and May 30, moving through the critical $28,600 level to move back above $30,000 to $31,700. The weekly close was the highest close of the past twenty days and it gave bulls the strongest three-day run in over two months. However, macroeconomic fears may weigh on any further upside potential. Global food shortage fears mount at commodities prices riseThe global food supply is a primary yet easily overlooked factor contributing to Bitcoin’s future price potential. Since the beginning of the COV-19 pandemic, governments worldwide have shut down their seaports and airports, effectively cutting off and interrupting the flow of goods. This disruption will take years to return to normal, but that is not the primary cause of concern. In the United States, fertilizer costs have risen exponentially over the past 18 months. In January 2021, the Fertilizer Price Index stood at $78.83 and is currently at $254.97, increasing nearly +225%. A combination of supply chain disruptions and continued shortages is likely to continue disrupting this market. Fertilizer price index Source: ycharts.comIndividual commodity prices continue to rise and are a primary contributor to the steady rise in inflation. In particular, wheat (CBOT: ZW) hit new all-time highs in February 2022 and remains near those all-time highs. In just 2022, alone, wheat futures have increased as much as 76% and over 143% in the past 18 months. Wheat futures (ZW) weekly chart (CBOT) Source: TradingViewOil futures (NYMEX: CL) continue to rise and are now trading at levels not seen since July 2008. There are broad concerns by traders and investors that oil may spike toward $150 per barrel once China ends its COVID shutdown. When that occurs, demand will most certainly return and further impact oil.Crude oil futures (NYMEX). Source: TradingViewGrowth concerns in the stock marketEquity markets around the globe continue to face significant pressure. Rising inflation, soaring commodity costs, supply chain disruptions and the conflict in Ukraine have put risk-on investors and traders on the defensive. Several high-impact economic events are scheduled to occur this week, which will likely pause any major price action moves in equities and cryptocurrencies. The European Union unemployment data release comes on June 1, along with the Bank of Japan’s interest rate decision and manufacturing data. In addition, U.S. unemployment numbers and non-farm payroll data will be released on June 3. Adding to a busy week, on June 3, three former U.S. Federal Reserve residents are also slated to speak: John Williams and James Bullard talk on June 1, Lael Brainard on June 3.Technical levels may limit Bitcoin’s recovery to $37,000Bitcoin is coming off a new historical record of nine consecutive weekly losses. Since the beginning of the current weekly candlestick, buyers have returned and have pushed BTC above the entire trading range of the past two weeks and well above the 50% range of the flash crash on the May 9, 2022 weekly candlestick. If Bitcoin price can close above the daily Kijun-Sen at or above $31,350, then BTC has a very open path to hit the $37,000 value area. Additionally, the 2022 volume profile is very thin, between $32,000 and $37,000. But $37,000 may be where the bulls face sellers again. BTC/USD daily Ichimoku Kinko Hyo chart. Source: TradingViewIf bulls want to send a message to the market that a new uptrend is about to begin, then they will need to push Bitcoin price to a daily close near $44,000. In that scenario, BTC would trigger an “ideal bullish Ichimoku breakout,” giving bulls the path needed to retest the all-time high.While stock prices remain in bear market territory and commodities remain at all-time highs, at the very least, a temporary reversal is likely to occur. If the old technical analysis adage, “volume precedes price,” plays out again, traders should see food commodities and oil sell-off while stocks and Bitcoin rise. The views and opinions expressed here are solely those of the author and do not necessarily reflect the views of Cointelegraph.com. Every investment and trading move involves risk, you should conduct your own research when making a decision.

Čítaj viac

Scott Minerd says Bitcoin price will drop to $8K, but technical analysis says otherwise

Bitcoin (BTC) is predicted to drop more than 70% to the $8,000 value area, according to comments by Guggenheim Chief Investment Officer Scott Minerd. This is not the first time he has made a bearish call, and he has, in the past, made bullish calls as well. However, Minerd’s more recent calls have occurred just before major reversals. Scott Minerd BTC price calls:- $600k at $60k → went to $30k.- $10k at $30k → price to $65k.- $8k at $30k (again) → TBD. pic.twitter.com/NWjrRdegFM— mhonkasalo (@mhonkasalo) May 23, 2022It should be noted that Mr. Minerd, if inferred from previous comments, is a Bitcoin bull and has a long forecast for the biggest digital asset in the six-figure range. However, if traders and investors used his comments as a sentiment indicator for a market low, then other confirmatory data must be used. Long term oscillators values support a bullish reversalThe weekly and monthly RSI (relative strength index) and composite index show extremes have been met. These extremes do not predict or guarantee a reversal. Still, they warn bears that further downside movement’s momentum is likely to be severely limited or eliminated. BTC/USD weekly relative strength index (RSI) (Coinbase) Source: TradingViewThe weekly RSI remains in bull market conditions, despite it moving below both the oversold levels of 50 and 40 – until it hits 30, the bull market RSI settings remain. Currently, at 33, this weekly RSI level is the lowest since the week of December 10, 2018, and just below the March 2020 Covid crash low of 33.48.Likewise, the weekly composite index reading for Bitcoin is at an extreme. It is currently at the lowest level it traded at since the week of February 8, 2018. The current level that the weekly composite index is at has historically been a strong indicator that a swing low is likely to develop. BTC/USD weekly composite index (Coinbase) Source: TradingViewThe black vertical lines identify the most recent historical lows in Bitcoin’s weekly composite index.Chart patterns on oscillators can help identify upcoming reversalsThe use of basic chart patterns like rectangles and triangles on Japanese candlestick or American barchart charts is not limited to just the price chart. For example, the great analyst and trader Connie Brown (the creator of the composite index) impresses analysts and traders to pay attention to chart patterns in oscillators. BTC/USD monthly (RSI) (Coinbase) Source: TradingViewThe falling wedge pattern on the monthly RSI fulfills all the requirements to confirm that pattern: five touches of the trend lines. It should be noted that the monthly RSI for Bitcoin, like the weekly RSI, remains in bull market conditions, and the current RSI is just below the first oversold level of 50. Another major development with Bitcon’s oscillators is the regular bullish divergence between the monthly RSI and the monthly composite index. The composite index, created by Connie Brown, essentially is the RSI with a momentum calculation – it catches moves that the RSI cannot. Note the structure of the lines on the monthly RSI compared to the composite index. The RSI shows lower lows, but the composite index shows higher lows. That is a regular bullish divergence.BTC/USD Monthly composite index (Coinbase) Source: TradingViewRegular bullish divergence is most often measured between price and an oscillator, but it can also be measured between two oscillators. Regular bullish divergence is a warning sign that the current downtrend will likely face a corrective move higher or the beginning of a new uptrend. Bitcoin price action remains correlated to stocksDue to the continued correlative behavior between Bitcoin and the broader cryptocurrency market to stocks, special attention should be given to this week, specifically Thursday (May 26, 2022). Economists and Wall Street continued to sound off worries about growth. After Target’s (NYSE: TGT) dismal quarterly report last week, all eyes are on other big name retailers announcing earnings this Thursday: Macy’s (NYSE: M), Dollar Tree (NASDAQ: DLTR) and Dollar General (NYSE: DG) are all on deck Thursday. However, given that much of the stock market is below bear market levels, any negative news from retail stocks or the United States Federal Reserve is likely to be considered “priced in.” Volume into the tech-heavy NASDAQ (NASDAQ: QQQ) has increased, as have inflows to Bitcoin and the wider crypto market. Thus, if stocks bounce, Bitcoin will bounce. The upside potential for Bitcoin will likely be limited to the critical psychological and 2022 volume point of control at $40,000. The views and opinions expressed here are solely those of the author and do not necessarily reflect the views of Cointelegraph.com. Every investment and trading move involves risk, you should conduct your own research when making a decision.

Čítaj viac
  • 1
  • 2

Získaj BONUS 8 € v Bitcoinoch

nakup bitcoin z karty

Registrácia Binance

Burza Binance

Aktuálne kurzy