Autor Cointelegraph By Elaine Hu

Fact or fiction? Did ApeCoin (APE) really drop by 80% since launch?

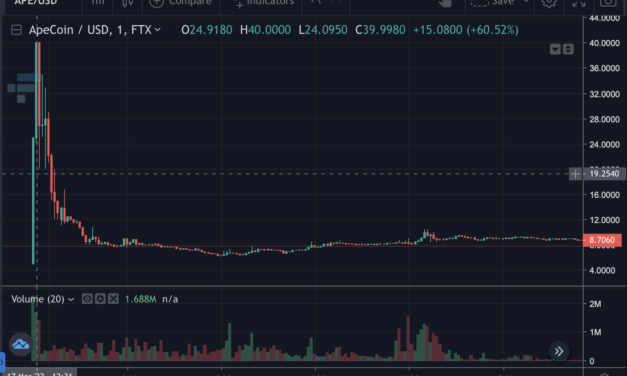
ApeCoin (APE), the governance token of the well-known Bored Ape Yacht Club (BAYC) NFT project was airdropped to BAYC and Mutant Ape Yacht Club (MAYC) owners at 8.30 AM EST on March 17 and only 8 hours after APE became tradable in the open market, it has already jumped to the 110th most traded token ranked by CoinGecko, totalling $900 million in trading volume across all tracked platforms.As one would expect, there were some volatile price movements minutes after the airdrop and headlines show the price of APE dropping 80% since its launch. This raises the question of whether the ordinary BAYC and MAYC owner actually could have sold APE at $40 instead of $14 that it trades for at the time of publishing.Let’s take a look at APE’s price minutes after the airdrop was claimed and the token listed on Binance, FTX, Gate and SushiSwap to assess the scale of the price discrepancies during the initial price discovery periods.ApeCoin spot 1-minute chart. Source: FTXThe spot price chart above shows that on the FTX one-minute chart APE was trading as high as $40 in the second minute but the perpetual price chart below shows in the first minute it only went up to as high as $15 at the highest point.ApeCoin perpetual 1-minute chart. Source: FTXBinance shows a high of $28 on the minute of the airdrop from the one-minute chart while Gate shows an unbelievably high $214 on the same minute.APE/USDT 1-minute chart. Source: BinanceAPE/USDT 1-minute chart. Source: GateWhile the price of newly listed tokens are often volatile during the initial price discovery periods and it is difficult to know if transactions actually happened at these levels, the volumes on these minute candles can give a good indication of what the actual price of APE was right after the airdrop.The trading volume of Binance is the highest among the three platforms used in this article and the reader should know that APE is also traded on other platforms. In the first 5 minutes, Binance’s total trading volume was $42 million, whereas FTX perpetual’s trading volume is in total $18 million and the spot volume is $6 million. Gate only has $1,665 trading volume on the candle that shows the highest price of $214 and in total only $43,000 volume in the first 5 minutes.So it is clear to see that the more reliable price of APE minutes after the airdrop is from Binance, which is around $28 and happened on the minute of the airdrop. It is not uncommon to see a large drop in price in the newly launched tokens in the early trading hours, as it happened to many similar tokens. The question is whether an ordinary non-tech savvy owner could have sold the token in the first five minutes to avoid such a drop. The answer is almost certainly no.First, the gas price for minting APE skyrocketed to 10 times (or even more) of the normal price right after the airdrop. Unless one is willing to take great risks bidding up the gas price to get the APE ahead of everyone else (and remember at this point the APE price is probably not discoverable anywhere), it is very difficult to even claim APE within one minute.Second, once APE is in the recipient’s Ethereum wallet, it has to be transferred to centralized exchanges (CEXs) such as Binance and FTX to be sold. This also takes some time depending on the traffic on the chain at the time. The quickest way would be to use a decentralised exchange (DEX) by simply connecting the Ethereum wallet and swap APE for another token.However, one interesting observation is that APE’s liquidity in the DEX is not as much as in CEX. The TVL at the time of writing on Uniswap is relatively small for APE-USDC and APE-DAI pools; and the liquidity on SushiSwap is very low — the total value locked (TVL) in the APE-USDT pool is only $67,000.APE liquidity pool as of March 17. Source: UniswapAPE/USDT liquidity pool as of March 17. Source: SushiSwapBAYC owners can claim about 10,000 APE per NFT and MAYC owners can claim about 2,000 APE per NFT. This means only 80 BAYC owners will be able to swap the entire airdrop at the price of $28 given the $45 million TVL of APE-USDC on Uniswap. No BAYC owners can swap the entirety of the airdrop on SushiSwap for USDT since the TVL of $67,000 cannot cover 10,000 APE swaps per BAYC or the 2,000 APE per MAYC at the price of $28.Given the lack of liquidity in the DEX and the time it takes to transfer APE to a CEX such as Binance, it is almost impossible for an ordinary owner to cash out in the first 1 to 2 minutes at the top. It seems only tech-savvy owners (or bots) who know how to interact with the blockchain directly with code can execute these types of transactions in such a short period of time. Even if the price of $40 is true and APE did drop 80% from there to $8, only very few were able to sell APE at that price. A more reasonable way to look at the initial price of a newly launched token is to use the volume of USD traded within the minute divided by the volume of the token. In the case of Binance in the first minute, the total USDT volume is 19.66 million and the total APE volume is 2.15 million, which gives an average price of $9.14 in the first minute for APE.APE/USDT first minute volume. Source: BinanceUsing this fairer way to look at APE’s price immediately after the launch, the token actually only dropped 12% since its peak, which is not overly dramatic given the current bearish environment. When investors read headlines such as the token price falls 80% on its first day next time, make sure to take it with a grain of salt.With Yuga Lab’s future plans to use APE for all its products and services and the collaboration with Animoca Brands to build blockchain NFT games, the future outlook for APE and the Web3 economy built around NFTs could be very interesting.The views and opinions expressed here are solely those of the author and do not necessarily reflect the views of Cointelegraph.com. Every investment and trading move involves risk, you should conduct your own research when making a decision.

Čítaj viac

Impermanent loss challenges the claim that DeFi is the ‘future of France’

Impermanent loss is one of the most recognized risks that investors have to contend with when providing liquidity to an automated market maker (AMM) in the decentralized finance (DeFi) sector. Although it is not an actual loss incurred from the liquidity provider’s (LP) position — rather an opportunity cost that occurs when compared with simply buying and holding the same assets — the possibility of getting less value back at withdrawal is enough to keep many investors away from DeFi.Impermanent loss is driven by the volatility between the two assets in the equal-ratio pool — the more one asset moves up or down relative to the other asset, the more impermanent loss is incurred. Providing liquidity to stablecoins, or simply avoiding volatile asset pairs, is an easy way to reduce impermanent loss. However, the yields from these strategies might not be as attractive. So, the question is: Are there ways to participate in a high-yield LP pool and at the same time reduce as much impermanent loss as possible? Fortunately for retail investors, the answer is yes, as new innovations continue to solve the existing problems in the DeFi world, providing many ways for traders to avoid impermanent loss. Uneven liquidity pools help reduce impermanent lossWhen talking about impermanent loss, people often refer to the traditional 50%/50% equal-ratio two-asset pool — i.e., investors have to provide liquidity to two assets at the same value. As DeFi protocols evolve, uneven liquidity pools have come into the picture to help reduce impermanent loss. As shown in the graph below, the downside magnitude from an equal-ratio pool is much larger than an uneven pool. Given the same relative price change — e.g., Ether (ETH) increases or decreases by 10% relative to USD Coin (USDC) — the more uneven the ratio of the two assets, the less the impermanent loss. Impermanent loss from even and uneven liquidity pools. Source: Elaine HuDeFi protocols such as Balancer have made uneven liquidity pools available since as early as the beginning of 2021. Investors can explore a variety of uneven pools to seek out the best option. Multi-asset liquidity pools are a step forwardIn addition to uneven liquidity pools, multi-asset liquidity pools can also help reduce impermanent loss. By simply adding more assets to the pool, the diversification effects come into play. For example, given the same price movement in Wrapped Bitcoin (WBTC), the USDC-WBTC-USDT equal-ratio tri-pool has a lower impermanent loss than the USDC-WBTC equal-ratio pool, as shown below.Two-asset vs. three-asset liquidity pool. Source: Topaze.blue/BancorSimilar to the two-asset liquidity pool, the more correlated the assets are in the multi-asset pool, the more the impermanent loss, and vice versa. The 3D graphs below display the impermanent loss in a tri-pool given different levels of the price change of Token 1 and Token 2 relative to the stablecoin, assuming one stablecoin is in the pool.When the relative price change of Token 1 to the stablecoin (294%) is very close to the relative price change of Token 2 (291%), the impermanent loss is also low (-4%).Simulation of impermanent loss from a tri-pool. Source: Elaine HuWhen the relative price change of Token 1 to stablecoin (483%) is very different and far away from the relative price change of Token 2 to stablecoin (8%), the impermanent loss becomes noticeably larger (-50%).Simulation of impermanent loss from a tri-pool. Source: Elaine HuSingle-sided liquidity pools are the best optionAlthough the uneven liquidity pool and multi-asset pool both help reduce impermanent loss from the LP position, they do not eliminate it completely. If investors do not want to worry about impermanent loss at all, there are also other DeFi protocols that allow investors to provide only one side of the liquidity through a single-sided liquidity pool.One might wonder where the risk of impermanent loss is transferred if investors do not bear the risk. One solution provided by Tokemak is to use the protocol’s native token, TOKE, to absorb this risk. Investors only need to supply liquidity such as Ether to one side, and TOKE holders will provide TOKE on the other side to pair up with Ether to create the ETH-TOKE pool. Any impermanent loss caused by the price movements in Ether relative to TOKE will be absorbed by the TOKE holder. In return, TOKE holders take all swap fees from the LP pool. Since TOKE holders also have the power to vote for the next five pools the liquidity will be directed to, they also get bribed by protocols who want them to vote for their liquidity pools. In the end, TOKE holders bear the impermanent loss from the pool and are compensated by the swap fees and bribe rewards in TOKE.Another solution is to separate risks into different tranches so that risk-averse investors are protected from impermanent loss and that risk-seeking investors who bear the risk will be compensated with a high-yield product. Protocols such as Ondo offer a senior fixed tranche where impermanent loss is mitigated and a variable tranche where impermanent loss is absorbed but higher yields are offered.Automated LP manager can reduce investors’ headachesIf all of the above seems too complicated, investors can still stick to the most common 50%/50% equal-ratio pool and use an automated LP manager to actively manage and dynamically rebalance the LP position. This is especially useful in Uniswap v3, where investors need to specify a range to which they want to provide concentrated liquidity.Automated LP managers conduct rebalancing strategies to help investors maximize LP fees and minimize impermanent loss by charging a management fee. There are two main strategies: passive rebalancing and active rebalancing. The difference is that the active rebalancing method swaps tokens to achieve the amount required at the time of rebalancing, whereas passive rebalancing does not and only swaps gradually when the pre-set price of the token is hit (similar to a limit order).In a volatile market where prices are constantly moving sideways, a passive rebalancing strategy works well because it doesn’t need to rebalance frequently and pay large amounts of swap fees. But in a trending market where price continues to move in one direction, active rebalancing works better because the passive rebalancing strategy could miss the boat and sit outside the LP range for a long time and fail to collect any LP fees.To choose the right automated LP manager, investors need to find the one that suits their risk appetite. There are passive rebalancing strategies such as Charm Finance that aim to earn a stable return by using a wide LP range to reduce impermanent loss. There are also passive managers such as Visor Finance that use a very narrow LP range to earn high LP fees, but are also exposed to more potential impermanent loss. Investors need to select automated LP managers based on not only their risk appetite but also their long-term investment goals. Although traditional equal-ratio LP profits could be eroded by impermanent loss when the underlying tokens move in very different directions, there are alternative products and strategies available for investors to reduce or completely avoid impermanent loss. Investors just need to find the right trade-off between risk and return to find the best-suited LP strategy. The views and opinions expressed here are solely those of the author and do not necessarily reflect the views of Cointelegraph.com. Every investment and trading move involves risk, you should conduct your own research when making a decision.

Čítaj viac

Here’s why the SEC keeps rejecting spot Bitcoin ETF applications

It is not the first time the U.S. Securities and Exchange Commission (SEC) rejected proposals for a Bitcoin spot exchange traded product (ETP), but efforts continue to be made by different financial institutions. The recent attempt made by Cboe BZX Exchange on Jan. 25 to list the Fidelity Wise Origin Bitcoin Trust as a Bitcoin ETP has also failed. The SEC letter published on Feb. 8 pointed out that the exchange has not met its burden to demonstrate the fund is “designed to prevent fraudulent and manipulative acts” and “to protect investors and the public interest”. Although proposals of Bitcoin spot ETPs have never been approved by the SEC and such products are not available in the U.S. market, they do exist in the European market. By investigating the prices of these ETPs traded in the European market, one could have a good insight into whether fraudulent and manipulative acts are possible.To investigate whether the SEC’s concerns of fraudulent and manipulative acts are justifiable, this article will compare the historic prices of three European listed ETPs and the Bitcoin spot price history from 18 exchanges to see if there are any significant price disparities that could induce market manipulation.The SEC’s primary concernsThere were two major concerns raised by the SEC from a technical perspective towards BZX Exchange’s proposal:(1) No data or analysis was provided to support the argument that arbitrage across the Bitcoin platforms helps to keep global Bitcoin prices aligned with one another, thus hindering manipulation and eliminating any cross-market pricing differences. There is no indication of how closely Bitcoin prices are aligned across different Bitcoin trading venues or how quickly price disparities may be arbitraged away.(2) The Exchange does not demonstrate the proposed methodology for calculating the index would make the proposed ETP resistant to fraud or manipulation. Specifically, the exchange has not assessed the possible influence that spot platforms not included among the index’s constituent Bitcoin platforms would have on Bitcoin prices used to calculate the Index.To see if the above issues exist and whether manipulative acts are possible within the ETPs listed in the European markets, historic data (from Google Finance) of the following three ETPs listed in SIX Swiss Exchange are compared with Bitcoin spot price from exchanges (data from Cryptowatch).WisdomTree Bitcoin ETP (BTCW-USD)21Shares Bitcoin ETP (SWX:ABTC-USD)Coinbase Physical BTC ETP (SWX:BITC-USD)Correlation between Bitcoin ETPs and spot price suggest price disparities existAs described in the proposal by BZX Exchange, the index calculation will be based on the volume-weighted median price (VWMP) in the previous five minutes from five exchanges — Bitstamp, Coinbase, Gemini, itBit, and Kraken. In a very simple and basic attempt to replicate the index calculation with best efforts, daily spot price from four out of the five aforementioned exchanges — Bitstamp, Coinbase, Gemini and Kraken are used.Since the Bitcoin ETP price scale is often different from Bitcoin spot price, daily percentage change (or daily return) is used in all charts for easy comparison of price disparities. The graphs below show the daily return comparison between each of the three ETPs and the aggregated Bitcoin spot price, calculated from the four exchanges using the volume-weighted median method. The left-hand-side scatter plot shows how closely the ETP price is aligned to the spot price. If the two are perfectly aligned, all the points should fall onto the blue dash line. The right-hand-side plot compares the daily percentage return and also plots the difference between the two. Comparing WisdomTree ETP and the spot, although most of the points in the scatter plot cluster within the +/-5% radius, there are certainly some significant price disparities outside this radius. There was one day during the three-month period that the daily return difference (blue dash line) between the ETP and spot price reached above 10%. Bitcoin spot from 4 exchanges vs. WidsdomTree ETP (in % change). Source: CryptowatchIt is also interesting to note that the volatility of ETP price percentage change tends to be higher than the spot. The graph below comparing Coinbase Physical Bitcoin (blue line) and Bitcoin spot (pink line) shows the percentage change of the former could reach nearly 15% whereas the latter only to 10%.Bitcoin spot from 4 exchanges vs. Coinbase Physical Bitcoin (in % change). Source: CryptowatchSimilarly, 21Shares Bitcoin ETP price is also more volatile than the spot and the correlation with the spot is lower (62%) than that of WisdomTree (67%) and Coinbase Physical Bitcoin (66%).Bitcoin spot from 4 exchanges vs. 21Shares ETP (in % change). Source: CryptowatchThe price comparisons shown above suggest cross-market pricing differences exist between ETP price and the Bitcoin spot price from exchanges. The price disparities have not been arbitraged away quickly enough to prevent manipulative acts.However, it is important to highlight that this is only a very rough comparison using the daily data. The difference in prices might be due to different cut-off time each ETP uses to calculate the end of day price, i.e. exchange traded products do not trade 24-hour like crypto spot price; they trade during the Exchange’s regular trading hours from 9:30 a.m. to 4:00 p.m.Also, in practice a much higher frequency will be used to calculate the index price, i.e.the BZX Exchange proposal suggests to calculate the index price using the previous five minutes data from five exchanges and update the Intraday Indicative Value (IIV) per share every 15 seconds. The analysis done here is only using daily aggregated data to proxy the index price and might not reflect the actual index price using high-frequency data.It is worth pointing out that although price disparities can be observed between ETPs and spot price using daily data, price discrepancies between the ETPs themselves are much smaller as shown in the graphs below. Scatter plot for price disparities between ETPs. Source: CryptowatchIt is very likely that these ETPs listed in the same exchange all use the same frequency and cut-off time to calculate their prices, hence the price differences among themselves are smaller. This reinforces the point that the price disparities between the Bitcoin ETP and Bitcoin spot price might come from the frequency and the cut-off time used in the methodology of ETP index calculation, which can not be replicated exactly the same in this analysis.Spot price disparities between exchanges are minimalIn the first point of concern mentioned at the beginning of the article, the SEC also asked how closely Bitcoin prices are aligned across different Bitcoin trading venues.Based on the cross-platform BTC/USD data collected from 18 exchanges from Cryptowatch, the exchange price disparities are very small. As an example to show how closely the prices align to each other, Coinbase, Gemini and Bitstamp are compared against Kraken and the correlation between each pair is very close to 100%.The SEC is also concerned about the possibility of price influence and manipulation from spot platforms that are not included among the index’s constituents. If Bitcoin prices from other platforms are very different from the 4 constituent platforms (Bitstamp, Coinbase Gemini and Kraken), market manipulators might seek to exploit the disparities for profit. To see if price disparities exist between the 4 platforms and the rest of them, the bottom right graph below compares the aggregated volume-weighted median price from the 4 platforms with the aggregated price from all 18 exchanges. The nearly perfectly aligned line shows there is almost no difference between the two. The spot platforms do not have large price disparities and the prices are closely aligned across different Bitcoin trading venues. Scatter plot for price disparities between exchanges. Source: CryptowatchWith such great similarity in daily prices, manipulative acts will be very difficult across exchanges. However, price manipulation could still happen intraday but it’s beyond the reach of this analysis due to lack of high-frequency intraday data.Based on the analysis from the three SIX Swiss Exchange listed ETPs prices and the Bitcoin spot prices from 18 exchanges, it seems price disparities do exist between ETP and spot. This could potentially lead to manipulative acts towards ETP index price, even though the applicants frequently claimed the sophisticated index calculation methodology prevents such acts. The SEC’s concerns about fraud and manipulation seems to be justified based on the price disparities between these European listed ETPs and the spot price. That said, the difference could be caused by the daily data frequency used in this analysis, which is different from the high-frequency data used in practice.On the contrary, no significant price disparities can be found among different Bitcoin trading venues. Although the spot markets from these venues are more decentralised and less regulated than traditional stock exchanges, malicious price manipulation across these platforms could still be very difficult.Given the large number of centralised and decentralised, regulated and unregulated crypto exchanges out there, it is extremely hard to prove price efficiency and similarity across all of them. The U.S. ETP applicants still have a long way to go to convince the SEC. The views and opinions expressed here are solely those of the author and do not necessarily reflect the views of Cointelegraph.com. Every investment and trading move involves risk, you should conduct your own research when making a decision.

Čítaj viac

3 things the crypto sector must offer to truly mainstream with TradFi

In the past year, we’ve seen the crypto economy undergo exponential expansion as heaps of money poured into various cryptocurrencies, decentralized finance (DeFi), nonfungible tokens (NFT), crypto indices, insurance products and decentralized options markets. The total value locked (TVL) in the DeFi sector across all chains has grown from $18 billion at the beginning of 2021 to $240 billion in January 2022. With so much liquidity in the ecosystem, the crypto lending space has also grown a significant amount, from $60 million at the beginning of 2021 to over $400 million by January 2022.Despite the exponential growth and the innovation in DeFi products, the crypto lending market is still only limited to token-collateralized loans, i.e. pledge one cryptocurrency as collateral to borrow another cryptocurrency. There are a few platforms such as Nexo and Genesis that provide NFT-collateralized loans but the service is mainly for institutional clients with blue-chip NFTs. For the retail masses, there isn’t much more than just the token-collateralized loans.If the crypto economy wants to grow to a size that is compatible with any real economy, it will have to reach out to the mass of retail consumers and be able to provide financing options to them. Here are the essential components that need to develop before crypto banking infrastructure can rival that of banks. Diversity of goods and servicesOne of the most commonly asked questions from someone who is new and wants to enter the crypto economy is — what can I buy? In the current infrastructure, there is not much other than NFTs, DeFi products, staking and liquidity provision.In a traditional economy, currencies exist because exchanging goods for services, or vice versa, generally does not have a 1:1 ratio, so currencies serve the purpose of facilitating transactions of goods and services. In the crypto economy, currencies exist before goods and services become widely available to customers. This makes crypto currencies hard to evaluate and unstable.An economy needs to have sufficient goods and services available to create enough supply and demand so consumers can use currencies to exchange for these goods and services. With only NFTs and DeFi financial products in the current crypto ecosystem, it is very hard to attract the ordinary Joe or Jane into the economy because there is simply not much for them to consume.A healthy and functional banking system also relies on sufficient supply of liquidity from customer deposits and sufficient demand from customers to borrow. With more digital goods and services, especially non-financial ones such as art, music, real estate or gaming gear in the metaverse, the banking system will be able to utilize them as collateral to provide a diversity of secured loans. Similar to car loans or mortgages, consumers in the crypto world will be able to own these products by paying periodically in the future. A reliable credit scoring systemIn the current crypto lending market, no credit check or credit scoring system is needed for customers to borrow any crypto currency. This is because the loan is over-collateralised with a strictly monitored loan-to-value (LTV) ratio. As soon as the LTV goes above the liquidation LTV threshold, the collateral will be sold at a discount to recover the loan. The collateral value is never fully utilised and there is always a large buffer reserved in case of sudden collateral value depreciation. In traditional banking, customers have a credit score based on their past transactional behaviour and financial condition i.e. annual income, savings, loan repayments and investments. In the crypto lending market this is almost impossible because the wallets are created anonymously and anyone can create as many wallets as they want. This makes it very difficult to track transactional behaviours and difficult to build a credit score.For the current structure to change, users need to be incentivised for building a good track record of all the activities within a wallet and being loyal to the wallet. There are scores such as LUNAtic Rankings for Terra to rank order engagements within a certain chain, but there doesn’t seem to be any credit-specific scoring to rank order wallet owners’ financial condition. As more jobs are created in the crypto space and more people are paid in cryptocurrency, wallets that show a long healthy track record of activities such as a constant income of cash inflow, continuous stable balance or regular repayments to a crypto loan, should be rewarded. The reward could be in the form of gaining access to larger loans with lower interest rates; or gaining access to longer-term loans; or even in the form of airdrops of governance tokens.A strong credit scoring system would benefit both the lender and the borrower. The lenders can earn more fees with lower risk by providing more loans to trust-worthy borrowers; the borrowers can have access to lower rates, longer-term loans and other potential rewards. Most importantly, a credit scoring system could help form a more transparent and healthy crypto lending market and attract more consumers to the ecosystem.An actively managed collateral evaluation systemGiven the highly volatile nature of cryptocurrencies (at least for now), the collateral value needs to be assessed much more frequently than in a traditional secured loan. Unlike traditional collateral such as cars or houses whose values are more predictable and do not change dramatically during a short period of time, the collateral in the crypto world, such as NFTs or crypto currencies, could encounter sudden downside movements in just one day. Therefore, it is essential for lending platforms to have robust collateral evaluation systems that can estimate the market value of any asset at any time.It is not difficult to evaluate the market value of NFTs or cryptocurrencies minute-by-minute. But as more goods and services become available in the crypto ecosystem and more types of assets become eligible as collateral, having a high-frequency collateral evaluation system can be costly. Alternatively, lending platforms can create something similar to the concept of risk-weighted assets (RWA) in the banking world to give more risk weights (lower liquidation LTV thresholds) to riskier collateral and less to safer ones so they don’t necessarily need to have a high-frequency collateral evaluation system. For example, blue-chip NFTs such as the Bored Ape Yacht Club (BAYC) can be given a higher liquidation LTV threshold and evaluated less frequently. As more historical NFT prices become available, more data points can be collected and used to derive a more accurate risk weight metric. As more goods and services become available in the crypto economy, a reliable credit scoring system and an actively managed collateral evaluation system will enable crypto banking infrastructure to provide more financing options other than token-collateralized loans. The future outlook of crypto finance is dependent on the types of goods and services available to the crypto economy and it can only rival the scale of traditional banks when the crypto economy grows into a more diversified and appealing market space to more consumers.The views and opinions expressed here are solely those of the author and do not necessarily reflect the views of Cointelegraph.com. Every investment and trading move involves risk, you should conduct your own research when making a decision.

Čítaj viac

Clever NFT traders exploit crypto’s unregulated landscape by wash trading on LooksRare

LooksRare made its debut on Jan.10 and the recently launched NFT marketplace has drawn a lot of attention, not only because its daily trade volumes were more than double Opensea’s on the second day of trading, but also because it has become the new playground for wash traders.Wash trading is a series of trading activities involving the same trader buying and selling the same instrument simultaneously, creating artificially high trading volume and a manipulated market price for the asset in play.In the United States, wash trading in traditional financial markets has been illegal since 1936 and the most recent highly publicized scandal related to wash trading is the manipulation of LIBOR in 2012. While wash trading has been highly regulated and closely monitored by exchanges and regulators, it seems to have found its new path in the unregulated crypto space and especially in NFT marketplaces like LooksRare.A community-owned marketplace is a double-edged swordLooksRare started with good intentions to share profits within the community. The token incentives and the trading rewards were essentially the secret weapon that attracted high volumes and beat Opensea in light-speed fashion right after its launch, but these same factors have also become the very weapon wash traders are using to flood the marketplace. LooksRare appears to have foreseen the possibility of wash trading that could be induced by the lucrative trading rewards, but according to LooksRare Docs, they believed the cost of trading from platform fees and royalty fees would be too high to create any incentives for wash trading. Interestingly, reality shows the opposite. LooksRare vs. OpenSea volume and unique users. Source: Dune Analytics @elenahooLooksRare vs. OpenSea volume and transactions. Source: Dune Analytics @elenahooThe graphs above show that daily users and daily transactions from LooksRare are only a tiny portion (2% to 3%) of OpenSea, but the volumes are more than triple or even quadruple OpeaSea’s. Using Jan. 19 as an example, the average trade volume on LooksRare is approximately $380,000 per user whereas on OpenSea it is only $3,000. Similarly, the average trade volume per transaction is around $415,000 on LooksRare, whereas for OpenSea it is only $1,676.Basically, what the data shows is a very small group of users executing trades worth hundreds of thousands dollars. This surely does not sound like a playground for normal NFT buyers. With a 2% platform fee, royalty fee and the volatile gas fee from the Ethereum network, wash traders seem to still be able to find a sweet spot to balance their cost and profit. Let’s have a look at how wash traders profit from buying and selling the same NFT.How trading rewards are allocated LooksRare’s trading rewards allocation. Source: LooksRareLooksRare’s trading rewards are distributed over a total of 721 days over four phases. The daily reward is the highest during the first 30 days in Phase A and the total reward is the highest in Phase C (240 days).LooksRare’s trading rewards allocation. Source: LooksRareThe amount of trading rewards a single trader can obtain for any given day is the product of the fixed daily LOOKS trading reward (2,866,500 LOOKS) and the ratio between the individual trader’s trading volume and the total trading volume of the day. Therefore, the more trading volume created by the trader, the more reward they get. This mechanism creates great incentives for large volumes of wash trading.In addition to the trading rewards, traders can also earn a portion of the platform fees collected based on the amount of LOOKS staked as well as staking rewards and liquidity provider rewards. But compared to the trading rewards gained from wash trading, the other rewards are too insignificant and close to a rounding error, so they will not be considered here.A closer look at a wash trader with $90 million in daily trade volumeThe largest LooksRare single-day trade volume was on January 19, 2022. By plotting the top 10 wallets traded on that day, two wallets stand out with more than $90 million U.S dollars traded on the day from each one as shown in the graph below. The activities from these two wallets also show back and forth buy and sells between them, which is a clear indication of wash trading. Top 10 Traders on the largest volume day — Jan 19, 2022. Source: Dune Analytics @elenahooMost of the time the wash traders choose NFTs with 0% royalty fee such as Meebits or Terraforms so the only costs from the trade are the 2% platform fee and the gas fee. In this specific example, on Jan. 19, the trader bought and sold Loot multiple times using these two wallets at a price around 6,500 times the floor price.An example of a wash trading on Loot. Source: LooksRareBased on the trading reward allocation and assuming the two wallets belong to the same trader, the total trading volume from this trader on Jan. 19 was $186 million; the trading reward earned from the trades is $6.2 million and the fee paid is $3.7 million (using $4.9 as LOOKS market price and 2% platform fee), resulting in a net profit of $2.5 million, which is 1.34% of daily return or equivalently 12,661% of annual return.Buy amount  on Jan 19, 2022 from the whale trader’s two wallets. Source: Dune Analytics @elenahooSell amount on Jan 19, 2022 from the whale trader’s two wallets. Source: Dune Analytics @elenahooMost trading rewards on LooksRare go to the wash tradersRewards claimed 24 hours prior to time of writing (Jan. 24, 2022). Source: Dune Analytics @elenahooLooking at the last 24 hours (as of Jan.24), 29% of the LOOKS rewards went to the top 10 traders. Similarly, when looking at the largest trade volume day, Jan. 19, 28% of the rewards went to the top 10 traders.Rewards claimed on Jan. 19, 2022. Source: Dune Analytics @elenahooA large portion of the rewards go to a small number of wash traders. This does not exactly follow LooksRare’s philosophy of “By NFT people, for NFT people.” Sharing the profit within the community seems to have failed so far and the lion’s share of the profit only goes to just a few traders.As Delphi Digital correctly pointed out, this model is unsustainable in the long-term and the trading volume is likely to drop significantly as wash traders gradually leave when it is no longer profitable. LooksRare still has a long way to go to compete with OpenSea in terms of number of users and non-zero royalty NFT trade volumes. It will be interesting to see how the dynamic changes when the trading reward reduces by half in Phase B starting on Feb. 10, 2022.The views and opinions expressed here are solely those of the author and do not necessarily reflect the views of Cointelegraph.com. Every investment and trading move involves risk, you should conduct your own research when making a decision.

Čítaj viac

Získaj BONUS 8 € v Bitcoinoch

nakup bitcoin z karty

Registrácia Binance

Burza Binance

Aktuálne kurzy