Autor Cointelegraph By Cointelegraph Consulting

Blockchain VC funding halves in October despite some strong raises

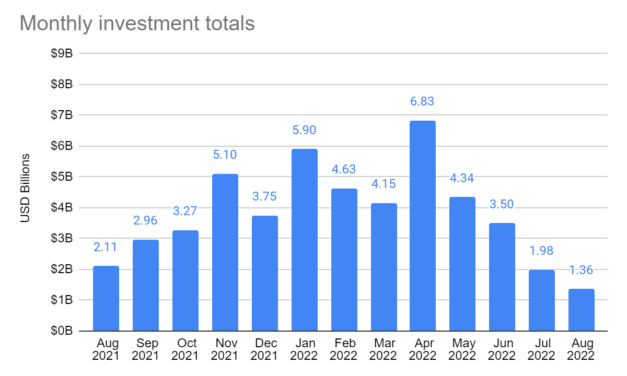
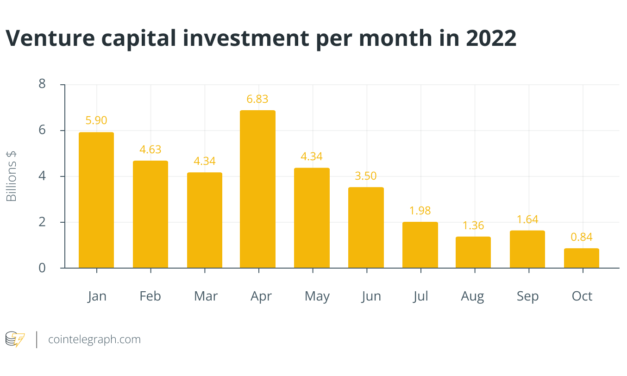
Blockchain venture capital inflows sharply decreased in October from the previous month. According to Cointelegraph Research, the number of individual deals dropped from 93 to 69 monthly.The Cointelegraph Research Terminal VC database, which compiles comprehensive details on deals, mergers and acquisition activity, investors, crypto companies, funds and more, shows venture capital inflows plummeted 48.6%, totaling $843.5 million in venture capital (VC) investment, down from $1.64 billion in September.Big raises despite difficult market conditionsIt’s not all bad news. Signals that there is still active interest by VCs in the blockchain industry are flashing daily. In the decentralized finance (DeFi) sector, Uniswap Labs — the team behind the largest decentralized exchange (DEX), Uniswap — secured $165 million in a Series B round led by Polychain Capital, with participation from investors such as Andreessen Horowitz, Paradigm, SV Angel and Variant. The series B funding round for the DeFi protocol brings Uniswap’s total valuation to $1.66 billion.Download and purchase this report on the Cointelegraph Research Terminal.Blockchain development platform Tatum raised $41.5 million from Evolution Equity Partners, Octopus Ventures, 3VC, Tensor Ventures, Depo Ventures, Leadblock Fund, Circle and the founders of Bitpanda.Meanwhile, crypto custodian Copper raised $196 million in its ongoing Series C round. The overall funding target for Copper has not been publicly determined. Barclays Ventures and Tiger Global Management led Copper’s latest fundraising. The company has previously received backing from Alan Howard, Dawn Capital and Target Global. Web3 continues to attract investor interestThe Web3 sector accounted for 42% of investor interest in October, with over $350 million flowing in. Investors are eyeing Web3 infrastructure companies. Chainsafe, a firm focused on protocol implementation and cryptographic technology, secured $18.75 million in a Series A led by Round13. Mobile games publisher Homa Games raised $100 million in a Series B funding round led by Quadrille Capital and Headline. Other participants included Northzone, Fabric Ventures, Bpifrance, Eurazeo and Singular participation. Homa has published mobile game titles such as Sky Roller, Aquarium Land and Z Defense.Scaling startup Celestia was also on investors’ radars, closing a $55 million deal to continue the development of modular blockchain technology. The round was led by Bain Capital Crypto and Polychain Capital, with participation from Spartan Group, FTX Ventures and Jump Crypto.For a full analysis of the blockchain VC sector in August, check out the monthly “Investor Insights” report from Cointelegraph Research. The research team breaks down the past month’s top market-moving events and the most critical data across the various sectors of the industry, including venture capital.The article pulls from Cointelegraph Research Terminals’ expansive Venture Capital Database. This article is for information purposes only. It represents neither investment advice, an investment analysis, or an invitation to buy or sell financial instruments. Specifically, the document does not serve as a substitute for individual investment or other advice.

Čítaj viac

Blockchain venture capital funding fell to a 12-month low in August

Data from Cointelegraph Research reveals that in August 2022, the blockchain industry saw $1.36 billion of venture capital invested in the blockchain industry — a 12-month low and the fourth consecutive month-on-month decline in capital inflows. August’s inflows represent a 31.3% drop from July’s $1.98 billion, and the 101 deals closed in August had an average capital investment of $14.3 million — a 10.1% decline from July. The data was drawn from the Cointelegraph Research Terminal’s Venture Capital Database, which contains comprehensive information on deals, mergers and acquisition activity, investors, crypto companies, and funds.For access to reports and databases, visit the Cointelegraph Research Terminal.August 2022 saw the lowest capital inflows in 12 months. Source: Cointelegraph Research VC DatabaseAugust’s funding focused on Web3, NFTs and infrastructureAugust’s three most popular investment categories were Web3, infrastructure and nonfungible tokens (NFTs), drawing more than $1.16 billion, or 85.4%, of the total capital. Some of the biggest deals include the following: Web3 game developer Limit Break raised $200 million. Barca Studios, FC Barcelona’s Web3 arm, raised $100 million from Chiliz, the owner of blockchain-based fan rewards platform Socios. Ready Player Me, a platform that allows people to create metaverse avatars, raised $56 million in a Series B funding round led by Andreessen Horowitz. Inworld AI, a developer platform for creating AI-driven virtual characters, raised $50 million in a Series A round led by Section 32 and Intel Capital.Sectors of investment interest in August 2022. Source: Cointelegraph Research VC DatabaseCoinFund is bullish despite the market conditionsVenture capital firms have been raising funds too. Web3 and crypto-focused venture capital firm CoinFund launched a new $300 million fund to back early-stage startups, emphasizing its bullish belief that Web3 will “continue to progress through all market cycles.” Orange DAO raised $80 million from the Algorand Foundation and Near and looks set to continue growing as an investment-focused decentralized autonomous organization backing crypto startups. Meanwhile, Shima Capital launched a $200 million debut capital fund to support emerging digital asset companies.For a full analysis of the blockchain VC sector in August, check out the monthly “Investor Insights” report from Cointelegraph Research. The research team breaks down the past month’s top market-moving events and the most critical data across the various sectors of the industry, including venture capital.Download and purchase this report on the Cointelegraph Research Terminal.This article pulls data from the Cointelegraph Research Terminals’ expansive Venture Capital Database. This article is for information purposes only. It represents neither investment advice, investment analysis, nor an invitation to buy or sell financial instruments. Specifically, it does not serve as a substitute for individual investment or other advice.

Čítaj viac

June gloom takes on a new meaning in another 2022 down month

The market cap of Bitcoin (BTC) dropped another 33% in June, which is now beginning to numb the Twitter community. On the upside, many crypto traders who wanted out did so fairly aggressively from March to May. But, the less optimistic news is that the stagnancy in address activity may need to change for prices to get a running start on recovery.Unlike April and May, the altcoin pack didn’t struggle tremendously more than Bitcoin. BTC’s 33% drop was pretty middle of the road in terms of corrections. In a vacuum, crypto bulls would prefer seeing altcoins continuing to lag, pushing more traders back toward Bitcoin as a relative “safe haven.”Nevertheless, June was a tale of two halves. June 1-15 saw a massive 25% further downswing for Bitcoin. Comparatively, June 16-30 was looking up until the very end of the month, which now exhibits an additional 8% slide.The $20,000 price level has shown to be both psychological support and resistance area. Therefore, a drop below (which could very well occur by the time this article is published) may quickly change traders’ outlook. Panic selling and overly eager buying should occur as soon as the $19,500 to $19,900 range is hit.Social dominance has returned to Bitcoin and away from altcoinsSo far, 2022 has served as a reality check for altcoins whose market caps have ballooned to astronomic levels in the past two years. As mentioned, Bitcoin was nothing special compared to alts in June, but it has held up better than most projects and even a few stablecoins. As a result, the spotlight shines bright on Bitcoin, as evidenced by a healthy community focus.This phenomenon was reflected in the whole last week of June. Bitcoin was mentioned on Santiment’s social platforms at its highest rate in about four months, while the discussion around other popular assets like Ether (ETH) and Cardano (ADA) continues to diminish.Trading returns still point to a major undervaluation of Bitcoin and most altcoinsThe average 30-day trading returns on the BTC network are still very negative. And, as long they are in the yellow-green or green territory in the below chart, there is less risk in entering a Bitcoin position (or adding on to) than historical results. Price freefalls tend to reverse if they go into the extreme low (green) territory, and that would be the ideal setup to watch for on Sanbase.The number of whale addresses is growing rapidly Another positive note for patient crypto hodlers, regardless of the asset, is that more and more Bitcoin shark and whale addresses are returning to the network. The addresses, mainly run by active human traders, sized 10 to 10,000 BTC, have over 147,000 addresses for the first time since November. Meanwhile, the very top-tier addresses owned primarily by exchanges (10,000 or more) showed over 100 addresses for the first time since December 2020.And, speaking of supply moving on and off-exchange addresses, the overall trend shows BTC continuing to move away from exchanges after a brief worrisome rise in May. Now, well below 10% of coins sitting on exchanges, there is far less selloff risk (based on historical trends). And, to add to this, the amount of Tether (USDT) moving to exchanges has skyrocketed, implying more buying power at these suppressed prices.Ethereum seeing far more negativity than any other large-cap assetNot to be ignored, Ethereum has had a well-documented 76% retracement since its all-time high in November. When looking at the ratio of positive vs. negative commentary being scraped by our social data algorithm, there appears to be a stunning dropoff in positive comments in early June. The 37% price drop between June 9 and 13 was the culprit and the last straw for many traders. As counterintuitive as it may seem, these “last straws” is what the community at Santiment expects to see for the market to stage a comeback.Cardano is also seeing the equivalent of slowly rolling tumbleweeds around its network. The number of unique addresses interacting on the Cardano network is down to its lowest in about a year. The sentiment is gradually sinking for Cardano as well, which is likely due to a simple absence of discussion more than anything.Traders heading into the second half with extreme skepticismIt is hard for the trading community to find any excitement in the abysmal price performances that continue to persist month after month in 2022. Yet, price surges happen when the mainstream casts the most doubts. Still, nothing is for certain in a sentiment-driven and often self-perpetuating sector like cryptocurrency. But, the more the crypto community is leaning bearish and proclaiming its crypto winter time, the higher the chance of a recovery underway.Cointelegraph’s Market Insights Newsletter shares our knowledge on the fundamentals that move the digital asset market. This analysis was prepared by leading analytics provider Santiment, a market intelligence platform that provides on-chain, social media and development information on 2,000+ cryptocurrencies.Santiment develops hundreds of tools, strategies and indicators to help users better understand cryptocurrency market behavior and identify data-driven investment opportunities.Disclaimer: The opinions expressed in the post are for general informational purposes only and are not intended to provide specific advice or recommendations for any individual or on any specific security or investment product.

Čítaj viac

Bitcoin trading: Momentum strategies with different moving averages

One of the simplest strategies for trading cryptocurrencies involves the application of moving averages (MA). The basic premise is that if the price of an asset is above its moving average for a certain number of days, this is considered a buy signal. Once it falls below its moving average, the asset is sold, and a cash position is maintained until the price crosses the moving average again in the upper direction.Cointelegraph Consulting’s latest bi-weekly newsletter issue looks at the many ways moving averages can be tweaked to catch Bitcoin price swings. Using Coin Metrics’ price data, this analysis is broken down into four parts. The first part uses trading strategies for different simple moving averages (SMA) — i.e., equal weighting of all past prices within the specified time window. The second part of this analysis looks at a specific form of moving average, the exponential moving average (EMA), where the weight of the more recent periods increases exponentially.The third part looks at strategies that only trade once significant momentum signals appear, namely the golden cross and the death cross. Finally, rolling returns of different moving average strategies will be considered to evaluate which strategy was most successful. Simple moving averages vs. exponential moving averagesFor the sample period chosen in the charts below, the 50- and 100-day SMA strategies outperform their EMA counterparts. However, choosing a 20- or 200-day EMA strategy yields better results compared to the simple moving average strategies. It comes with the added benefit that maximum drawdowns are significantly lower. In general, it is not clear which type and length of moving average will yield the best results. As EMAs put higher weight on more recent market moves, they are more likely to provide a trading signal earlier, albeit at the cost of some signals being wrong.Comparison based on different entry pointsSome of the strategies described above appear to be successful. However, beating the market is more difficult than following simple timing strategies. Especially in a bull market, many strategies yield results simply because the general trend is positive. In more difficult times, many strategies cannot shield from incurring losses. If one invested based on these strategies in January 2022, all strategies would have beaten the market. The 200-day MA strategy would have signaled not to invest at all, which would have yielded the best outcome. All other strategies generated losses. The 50-day MA strategy illustrates how false signals can lead to value destruction that can at times exceed losses from a simple buy-and-hold strategy. “Two crosses” strategyIn the field of technical analysis, traders often talk about the golden cross and the death cross. Both terms refer to the behavior of moving averages to each other. The most common version of the golden and death cross is related to the 50-day and 200-day MA. Once the 50-day MA moves above the 200-day MA, this golden cross signals an upcoming bull market, while the death cross — i.e., the 50-day MA moving below the 200-day MA — often marks the start of a bearish period. The strategy that only considers a golden cross and death cross gets the general market trend right. It enters ahead of significant uptrends and exits once a serious downturn occurs. However, as this strategy reacts to larger market trends, it does take some time to exit the market and enter it again. This can shield from heavy losses but may also lead to some missed opportunities when the market changes direction.Rolling analysesThe above results show that strategies based on moving averages are no panacea for bear markets or market fluctuations. Since the entry point matters for the performance of such strategies, one should look at different starting points. The chart below shows what returns could have been made by applying a given strategy for one year — i.e. the return displayed for Jan. 1, 2017, is the result of a strategy that started on Jan. 1, 2016.The same analysis can be done by executing each strategy for two years instead of one. While differences between strategies are at times wider compared to the analysis with one-year returns above, a similar picture emerges as the 20-day MA strategy yielded promising returns in 2018 and 2019, while the 50-day MA strategy performed better in 2021 and 2022. Yet in both analyses, a simple buy-and-hold strategy can outperform for some periods of time.Rolling returns of executing a strategy for three years are qualitatively not too different from the two-year rolling analysis but come with higher returns in market run-ups, except for the one in 2021. However, when comparing all three time windows, it becomes clear that the ordering of strategy success can change over time. While the 20-day MA strategy has been dominant for some years (depending on the time frame of the rolling analysis), it has significantly underperformed in other years. The same can be said about the other strategies. Therefore, past returns are not a reliable predictor of the future success of a particular strategy. Averaging outMomentum strategies based on moving averages can provide some guidance for traders and may at times provide relevant information about the general market trends. Nonetheless, they should be treated with caution as length, type of moving average, and starting point of an analysis can yield different results. Investors should carefully evaluate the data used and make sure that they are able to react to any signal in a timely manner. Cointelegraph’s Market Insights Newsletter shares our knowledge on the fundamentals that move the digital asset market. The newsletter dives into the latest data on social media sentiment, on-chain metrics and derivatives.We also review the industry’s most important news, including mergers and acquisitions, changes in the regulatory landscape, and enterprise blockchain integrations. Sign up now to be the first to receive these insights. All past editions of Market Insights are also available on Cointelegraph.com.Disclaimer: The opinions expressed in the post are for general informational purposes only and are not intended to provide specific advice or recommendations for any individual or on any specific security or investment product.

Čítaj viac

The crypto market dropped in May, but June has a silver lining

May 2022 was not for the faint-hearted. Even the most embattled and experienced crypto traders were tested in the first two weeks of the month on a brutal drop following the United States Federal Reserve’s announcement that interest rates would be rising by 0.5%.Crypto used to exhibit a lower correlation with real-world events and was generally unaffected by capitalistic successes and failures. However, a very steady approximate peg between Bitcoin (BTC) and the S&P 500 index was seen throughout the first five months of 2022. Inflation and war fears have not been kind to both markets either.Crypto mimicking the equity market could be due to the massive market capitalization growth in 2020 and 2021. At unprecedented rates, retail investors from equities have flocked to cryptocurrencies, causing a far greater overlap in price movements.Bitcoin dipped below $29,000 before coming back up to $31,800 on May 31, while Ether (ETH) fell to just above $1,700 before reclaiming prices above $1,900 by May 30. But many altcoins fared far worse, and the resulting reactions from once-patient traders turned to about as much FUD as one would imagine.Four stablecoins, two different directionsTerraUSD (UST) — now known as TerraUSD Classic (USTC) — was a stablecoin built on the Terra blockchain and sitting in the top six stablecoins by market cap. However, on May 9, the coin, which was designed to maintain a $1 value all the time, progressively dropped down to $0.29, leaving the crypto world in shock. Its price has not recovered since.As for how this impacted the rest of the stablecoin landscape, a major “shuffling of the deck” resulted from a trusted stablecoin’s reputation imploding overnight. Tether (USDT), the largest stablecoin by market cap, saw a fall of its own, albeit one much less drastic, to $0.95. It has since recovered, but there have been renewed claims about the coin’s solvency.Dai (DAI) and USD Coin (USDC) seemed to reap the reward amid the debacle as the above chart clearly indicates the top 10 largest whale addresses from each stablecoin show an increased trust level in these two assets, and coins moving in massive waves onto exchanges from USDT and UST (now TerraUSD Classic). Binance USD (BUSD) also can’t be ignored, as the third-largest stablecoin grew to a nearly $19-billion market cap last month.LUNA’s tragic fall from graceUST’s sister token LUNA Classic (LUNC) — the updated name for the original LUNA token — plunged from its all-time high of about $119 just seven weeks ago and now sits at a staggering $0.000125, equating to a -99.9999% decrease in price and market cap. UST’s depegging from $1 appeared to be the final nail in the coffin as the algorithm wasn’t swift enough to burn LUNC when UST was in freefall due to large withdrawals on the Anchor Protocol.But while the story of LUNC may seem like old news at this point, talks of LUNA 2 —the new version of LUNA — appear to be bringing in some new life and optimism. The project’s GitHub has actually exploded with new action at a rate that has never been seen from the original LUNC.Bitcoin trader sentiment at historic pain levelsBitcoin could be reaching a bottom as sentiment hit its most negative levels since March 2020. The social dominance of BTC also gets smaller and smaller. Typically, three waves of diminished dominance of BTC is a clear sign that traders are no longer interested in buying a frustrating and unpredictable “dip.” And when traders lose interest, prices historically wake up.Among Telegram, Reddit and Twitter social volume, the three platforms have seen wildly different discussion rates about crypto over the past year, let alone the past couple of months. Reddit saw by far the most notable spike when prices bottomed out about two weeks ago, while Telegram discussions have completely died down.BTC amount held by whales is low, address count risesThere is good and bad news about May’s Bitcoin whale activity. The good news is the number of whale addresses holding 100–1,000 BTC has risen for about four straight months now, a trend that began seeing a turnaround in late January. Meanwhile, the bad news is the actual total amount held by these whale addresses still shows a long-term dump pattern dating back to late October, right before the all-time high.Dai velocity staying low, a good sign for EtherWith top altcoin Ether, there appears to be a correlation between its price and the amount of velocity, which is the average number of times that a coin changes wallets every day, as seen on the Dai network.A series of major spikes in Dai’s velocity was seen weeks after Ether’s mid-November all-time high but has been fairly dormant in recent months. As long as this metric remains at low levels, there’s no threat of an isolated dump for ETH compared to the rest of the cryptocurrency market.Ethereum fees are also encouragingly quite dormantOn top of the low velocity on Dai, fees on the Ethereum network are approaching year lows. With so much stagnancy among many networks, this has caused the cost per transaction to decline.The above chart illustrates the massive spike in average fees (to $98) in mid-May. This was an obvious sign that some further downside was likely. One can only hope that fees stay down where bulls like them.Cointelegraph’s Market Insights Newsletter shares our knowledge on the fundamentals that move the digital asset market. This analysis was prepared by leading analytics provider Santiment, a market intelligence platform that provides on-chain, social media and development information on 2,000+ cryptocurrencies.Santiment develops hundreds of tools, strategies and indicators to help users better understand cryptocurrency market behavior and identify data-driven investment opportunities.Disclaimer: The opinions expressed in the post are for general informational purposes only and are not intended to provide specific advice or recommendations for any individual or on any specific security or investment product.

Čítaj viac

Získaj BONUS 8 € v Bitcoinoch

nakup bitcoin z karty

Registrácia Binance

Burza Binance

Aktuálne kurzy