Autor Cointelegraph by Biraajmaan Tamuly

Bitcoin Coinbase Premium turns negative as BTC price drops, weekly losses top $829M

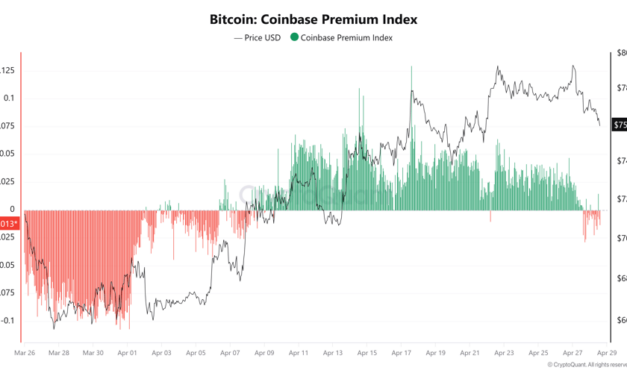
Bitcoin’s (BTC) Coinbase Premium Index has turned negative at -0.008 for the first time in three weeks, signaling a sharp reduction in US spot market demand and aligning with BTC’s current price drop. The signal held across hourly readings through the next 48 hours, showing consistent selling pressure from US-based buyers. The shift comes as the net weekly average of BTC realized losses climbed to $829 million, suggesting reduced investor conviction. Bitcoin Coinbase Premium Index. Source: CryptoQuantCrypto trader Ardi highlighted a break in both trendline support and the $77,300 liquidity zone. The trader linked the move to weakening spot demand, noting that the premium has posted consecutive red readings for the first time since BTC was near $67,000. Ardi said that price action during the Federal Open Market Committee (FOMC) meeting window could remain volatile, with rapid moves in either direction. Traders could place focus on the $74,500–$75,500 range as a key downside area tied to demand exhaustion.Onchain data adds to this view. Crypto analyst Darkfost noted that the weekly realized losses reached $829 million on a seven-day average, compared to $566 million in realized profits. The net realized profit briefly turned positive on April 9, then reversed within two weeks. Bitcoin net realized profit/loss [USD] 7DMA. Source: CryptoQuantThe share of supply in profit stands at 64%, a level that has not historically supported sustained upside. This indicates weaker conviction among holders despite the recent rebound.Related: Bitcoin price hits one-week low as $100 oil sparks fresh Asia crisis fearsBitcoin sell volumes at Binance reach $828 millionDerivatives data shows strong sell-side activity on Binance. Crypto analyst Amr Taha noted that the 24-hour cumulative net taker volume dropped by $828 million on April 27, the lowest reading since late March. BTC cumulative net taker volume on Binance. Source: CryptoQuantNegative net taker volume indicates that the market’s sell orders exceed its buy orders. The Binance taker buy/sell ratio has also fallen to 0.89, a level last recorded on March 29.That earlier reading aligned with a local pivot when Bitcoin tested $66,000, then recovered by 15% over the past 30 days.The current readings place both metrics back near prior exhaustion zones. Taha described the setup as closer to a short-term capitulation than a larger trend breakdown.Related: Can Bitcoin hit $250K this year? Traders say it may be time to ‘sell in May’This article is produced in accordance with Cointelegraph’s Editorial Policy and is intended for informational purposes only. It does not constitute investment advice or recommendations. All investments and trades carry risk; readers are encouraged to conduct independent research.

Čítaj viac
Ether triple top strikes at $2.4K as ETH analysts doubt bullish trend change

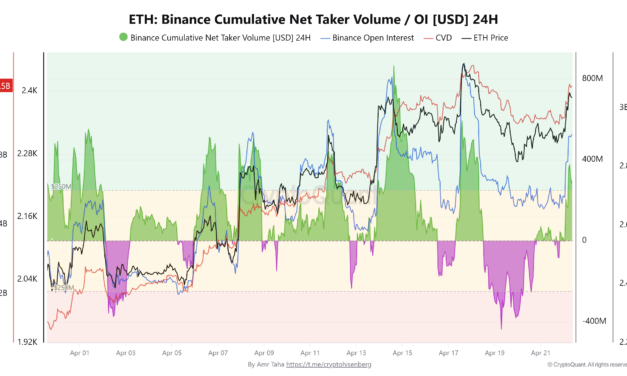
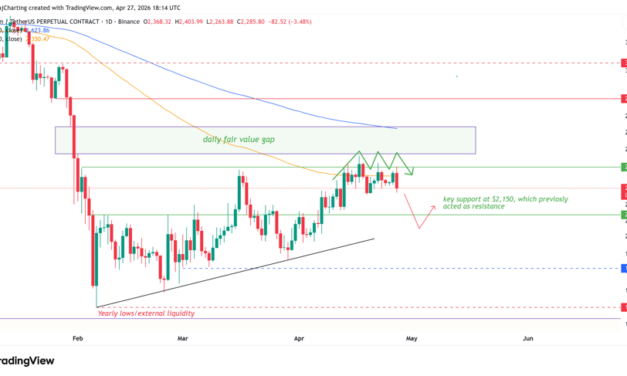
Ether (ETH) fell 3.4% to $2,287 on Monday, after its fourth rejection at the $2,400 level since April 14. The price continues to trade below the 100-day moving average, with over $2.5 billion in liquidation risk concentrated near the $2,150 support zone.Crypto analyst Michaël van de Poppe also flagged weakness in Ether relative to Bitcoin, raising doubts about the strength of any near-term uptrend. Repeat rejections at $2,400 cap ETH’s upsideEther has failed to break $2,400 four times over the past two weeks, forming a clear triple top pattern on the daily chart. Each retest saw a loss of strength near that level, suggesting supply absorption by sellers.The 100-day exponential moving average (EMA) near $2,350 continues to act as a dynamic resistance. The price has not held above it on the one-day chart, keeping upside attempts short-lived. ETH/USDT on the one-day chart. Source: Cointelegraph/TradingViewThe support at $2,150 now carries more weight. The level previously acted as resistance and could be tested as a base in the coming days. A move below it opens the door to deeper downside levels.Liquidation data adds pressure to this zone, with $2.5 billion in leveraged longs sitting below $2,150. A break below this level could trigger forced selling into the $2,050 to $1,900 range.Ether liquidation map. Source: CoinGlassMN Capital founder Michaël van de Poppe noted weakness in the ETH/BTC pair. The ratio dropped below 0.032 BTC, removing a key support level tied to prior continuation attempts. The ETH/BTC ratio also slipped under the 21-period moving average, signaling fading relative strength against Bitcoin. The next higher-time frame level sits near 0.026 BTC, where buyers previously stepped in.ETH/BTC chart analysis on Binance. Source: CryptoQuantRelated: BitMine acquires 101,000 ETH despite $6.5B in unrealized lossesETH futures positions hint at a market resetOn Binance, Ether’s open interest (OI) has dropped to $2.58 billion, matching levels seen when ETH traded near $2,200 earlier this month. The decline points to a reset in leverage following the recent positioning buildup.ETH: Binance cumulative net taker volume. Source: CryptoQuantThe funding rate offers a clearer signal, sitting near -0.013%, the lowest reading since February. The short positions dominate new activity while earlier long exposure has been reduced.Crypto analyst Amr Taha noted that this combination places ETH in a shorts-heavy setup with lower leverage. If price holds near current levels, the imbalance between positioning and price could tighten, leading to a breakout sooner than later.The key zone centers on $2,150, where liquidation risks and the current technical level converge on the daily chart.Related: ETH price up 10% in April, so why is Ethereum Foundation selling?

Čítaj viac

Bitcoin whale holdings hit five-month high: Is BTC headed to $80K next?

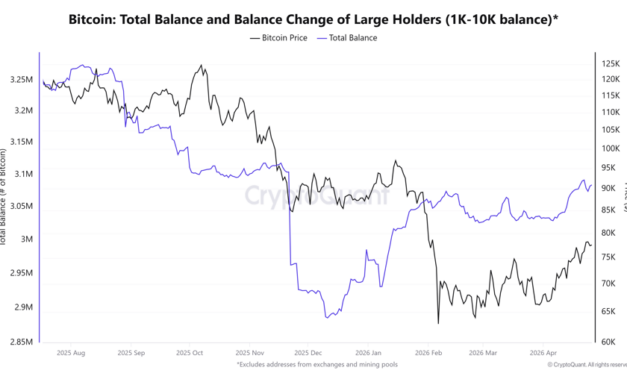
Bitcoin (BTC) whales holding between 1,000-10,000 BTC have increased their BTC exposure over the past five months, with the total balance reaching 3.09 million, a level last seen on November 11, 2025.Short-term data suggest that Bitcoin traders may move toward existing liquidity at $73,700, but futures market activity and the longer-term market structure hint at higher levels above $80,000. Bitcoin whales and institutions rebuild BTC exposureBitcoin wallets holding between 1,000 and 10,000 BTC have been steadily accumulating since December, adding approximately 240,000 BTC to their balances.This brings the cohort’s total holdings to around 3.09 million BTC, recovering to pre-correction levels last seen before Bitcoin’s 18% pullback in November 2025, when the price declined to $85,000 from $103,500.Total BTC balance of large holders. Source: CryptoQuantThe long-term holders (LTHs) continue to absorb supply at a steady pace. LTHs’ balance has reached 14.57 million BTC, aligning with the prior accumulation peaks. The distribution activity was 42,100 BTC sold over the past 30 days, one of the lowest readings in 2026.BTC long-term holder flow. Source: CryptoQuantThe Crypto Market Compass report from Bitwise highlights a similar trend across institutional flows. Over the last month, the institutional investors have added about 92,900 BTC.The onchain realized cap flows show only 14,900 BTC in net selling during the same period. This report indicates that the demand from larger players has outpaced sell-side pressure, tightening the available BTC supply.Rise in BTC institutional demand. Source: BitwiseRelated: First 21-week trend line reclaim since October 2025: Five things to know in Bitcoin this weekBTC double top pattern indicates a short-term liquidity sweep at $74KThe four-hour chart shows a potential double top forming near $79,400 after two quick rejections for BTC over the past week. The second pullback came late Sunday night, with weaker buy volumes, pointing to fading short-term momentum.Currently at $77,731, the price may rotate toward liquidity pockets near $74,700 and $73,700.BTC/USDT on the four-hour chart. Source: Coinelegraph/TradingViewThe $74,700 level aligns with a prior consolidation range and sits just above the 100-period exponential moving average (EMA). A deeper move into $73,700 would test key higher-time-frame support and a prior higher-low range.Holding above this zone keeps the broader trend intact and maintains room for a bullish continuation.The derivatives market activity is adding short-term pressure to Bitcoin price. Crypto analyst Darkfost noted that over $1.2 billion in sell volume hit Binance within an hour, contributing to a sharp intraday decline on Sunday.The funding rates have also stayed deeply negative, reaching -7% on a 30-day basis, one of the lowest readings ever recorded. Bitcoin: taker sell volume on Binance. Source: CryptoQuantHowever, such positioning may create conditions for a short squeeze, in which crowded short positions unwind, driving the price higher. A move above $80,000 would invalidate the double-top signal and turn short-term momentum bullish again.According to MN Capital founder Michaël van de Poppe, the price continues to hold key levels, with upside targets of $85,000-$88,000 still valid for May. The liquidity range between $74,700 and $73,700 now serves as a reset zone, where BTC demand could be tested ahead of another breakout attempt above $80,000. Related: Michael Saylor’s Strategy adds 3.2K Bitcoin at nearly $78K per BTC

Čítaj viac

Bitcoin chases monthly high above $80K as nearly all BTC price metrics turn bullish

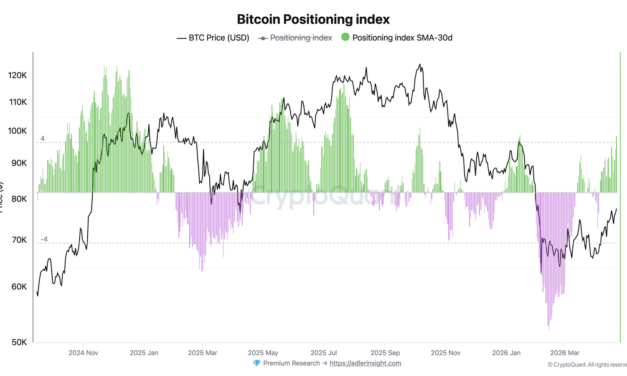
Bitcoin (BTC) reached a monthly high of $79,472 on Wednesday, marking its strongest 28-day return since April 2025. The rally aligns with a shift in a market positioning metric and a surge in leverage use. A combined view of the market positioning metric and open interest shows new positions are being added, potentially influencing BTC’s push toward new highs.BTC positioning builds with rising leverageBitcoin researcher Axel Adler Jr. said that the Bitcoin positioning index has turned higher, with its 30-day average rising to 4.5 from -10.9 in February. The indicator blends net taker flow direction, open interest trends, funding and the exchange balance into a single metric. Bitcoin positioning index. Source: CryptoQuantIts steady climb since late March, from 0.4 to current levels, shows a consistent improvement without breaking the price trend.The growth in open interest confirms the same trend. The 30-day change stands at +14.5%, with 23 of the past 30 sessions closing positive. The rising positioning alongside expanding open interest signals new capital entering derivatives markets.BTC open interest 30D change. Source: CryptoQuantOver the past 24 hours, the aggregated open interest also rose 6.7% to 260,000 BTC, while the price experienced a 10.7% drop in leverage over the weekend. Related: Bitcoin Bull Score hits six-month high as 2022 bear-market fears lingerKey BTC levels to watchBitcoin has moved above a descending trendline dating back to the October 2025 peak near $126,000 and has reclaimed the 100-day exponential moving average (EMA). This indicates a strong shift in trend from bearish to neutral-to-bullish on the higher time frame. The $81,000 level now serves as the first test area, with a small fair-value gap indicating a liquidity imbalance, where a price hold would signal that buyers are accepting higher prices.BTC/USDT on the daily chart. Source: Cointelegraph/TradingViewAbove that, $88,000 stands as the supply zone tied to prior distribution. The $88,000–$91,000 range stands out as a key supply zone, shaped by a prior distribution phase when large volumes of Bitcoin last changed hands. Many of those holders are now sitting near break-even or in slight profit, which typically increases activity when the price revisits that area.Adding to this, the realized price of the three–to-six–month holder cohort sits at $91,600, further reinforcing this zone as a major decision point.A sustained move through this range would signal strong demand, showing that buyers are absorbing overhead supply and setting the stage for Bitcoin price to move higher.Crypto analyst Crazzyblockk highlighted a tight range, with the $72,000–$75,000 zone acting as a floor, supported by clusters of realized prices from mid-term holders. A break below this band would push more supply into loss, increasing the risk of reactive selling.BTC: age-band realized price distribution. Source: CryptoQuantOn the upside, the $83,000–$85,000 marks a profit-taking zone for recent short-term holders. Price strength through this range would signal that buyers are absorbing the supply, allowing momentum to build.Related: ‘Powerful move’ looms for Bitcoin price, says Bollinger Bands indicator

Čítaj viac

Získaj BONUS 8 € v Bitcoinoch

nakup bitcoin z karty

Registrácia Binance

Burza Binance

Aktuálne kurzy