
Autor Cointelegraph by Biraajmaan Tamuly

Three Bitcoin data points suggest a rally to $80K is imminent

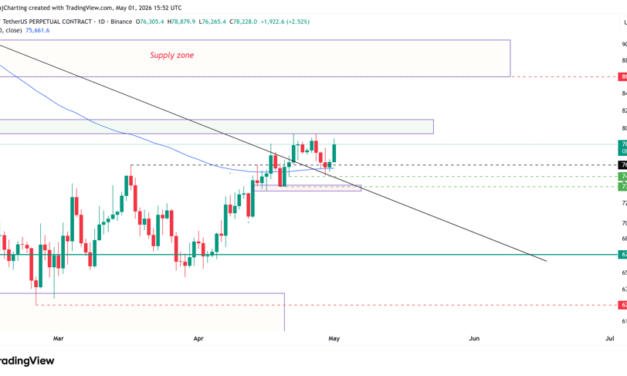
Several Bitcoin (BTC) data points suggest that $80,000 is the next destination for the cryptocurrency. Bitcoin gained 2.52% to trade above $78,800 on Friday after holding support at the 100-day exponential moving average. Spot market buy volumes also strengthened while the cumulative volume delta (CVD) reached 11,500 BTC, its highest level since Feb. 17. BTC futures activity is picking up, with the open interest rising 6.64% to 257,000 BTC, indicating fresh positioning.Bitcoin’s daily trend recovery shows fresh positioningBitcoin rebounded from its 100-day exponential moving average (100-EMA) after retesting the daily trend over the past two days. The move lifted the price by 2.52% to $78,800 on Friday, holding the short-term uptrend intact.The 100-day EMA, currently acting as dynamic support on the daily chart, suggests that the higher time-frame chart remains bullish. BTC/USDT on the one-day chart. Source: Cointelegraph/TradingViewThe spot demand is strengthening at the same time. The spot cumulative volume delta (CVD), which tracks net buying versus selling, reached 11,500 BTC, a new high since Feb. 17. This indicates buyers are absorbing the supply during the recent dip. Derivatives positioning is expanding in tandem with price, pointing to fresh participation. The aggregated open interest has risen 6.64% to 257,000 BTC over the past 24 hours, indicating new positions are being added as Bitcoin consolidates below $80,000. BTC price, spot, and futures CVD. Source: VeloThis follows a recent leverage flush of roughly 9,000 BTC, suggesting that excess positioning has been cleared as the leveraged market rebuilds. The futures CVD adds further context. Futures volume has recovered to 98,300 BTC, signaling a return of net buying pressure. However, it remains below the levels seen during the April 27 correction, suggesting trader positioning is still developing. At the same time, liquidity continues to cluster in the $78,000–$80,000 range, with $2.1 billion in short positions at risk, which could lead to a short squeeze near the key level.Bitcoin liquidation heatmap. Source: CoinGlassRelated: Bitcoin ETFs draw $2B in April for highest monthly inflows this yearBTC demand from institutions tightens the available supplyBTC institutional activity continues to lean supportive. The 30-day change in OTC desk balances has fallen to around -20,700 BTC, matching levels last seen in March 2025. The lower balances indicate BTC moving off desks, reducing the immediately available supply.Bitcoin: Total OTC desk balance. Source: CryptoQuantThe exchange-traded fund (ETF) flows show a similar pattern. With ETF flows reaching $1.97 billion in April. Bitcoin research newsletter Ecoinometrics noted a nine-day streak of inflows, the longest in 2026.Ecoinometrics explained that while the pace of inflows is moderate, the consistency has improved, adding, “The last time flows showed this kind of persistence was right before the October 2025 peak. Not saying we’re there yet, but it tells you the direction is improving.”The near-term focus is on how long flows sustain themselves and whether liquidity above $80,000 thins as spot, futures, and institutional participation increase.ETF inflow streak improves for Bitcoin. Source: Ecoinometrics/XRelated: Bitcoin’s $75K cost basis emerges as key support zone for current bull trendThis article is produced in accordance with Cointelegraph’s Editorial Policy and is intended for informational purposes only. It does not constitute investment advice or recommendations. All investments and trades carry risk; readers are encouraged to conduct independent research.

Čítaj viac
Repeated Bitcoin profit taking near $77K suggests rally is losing steam

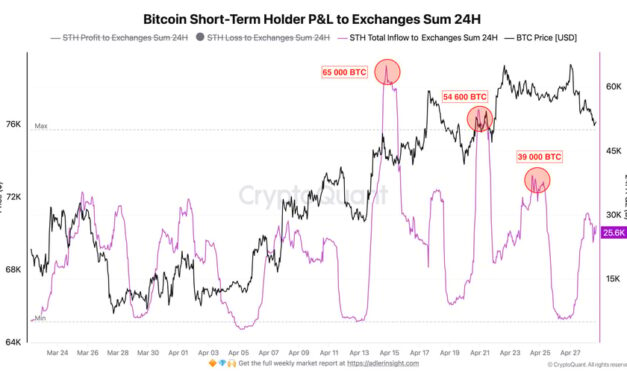
Bitcoin’s (BTC) attempt to trade above $77,000 have failed multiple times over the past week, despite traders managing a one-day breakout to $79,500. Data show short-term holders taking profits as the rally peaked, sending 150,000 BTC to exchanges since April 15. Crypto analyst Darkfost noted the continued fragility among short-term holders (STHs), or wallets holding BTC for less than 155 days. As the price rose over the past two weeks, BTC transfers from these wallets to exchanges increased.Three consecutive sessions saw 65,000 BTC, 54,600 BTC and 39,000 BTC sent to exchanges and these flows may have prevented Bitcoin from overtaking the resistance level at $80,000.BTC short-term holder supply to exchanges. Source: CryptoQuantSpot volumes also declined sharply. BTC activity has dropped to levels last seen in September 2023, near the end of the previous bear phase. Binance recorded a monthly decline of about $25 billion in volume. Gate.io also saw a $13 billion drop, while OKX volumes fell by roughly $6 billion.This indicates weaker investor conviction to build spot exposure at current price levels. Darkfost explained, “This contraction in volumes therefore reflects a temporary loss of interest in Bitcoin. While declining spot volumes can suggest negative short-term momentum, these phases of apathy are also often where new opportunities begin to emerge.”BTC spot trading volume. Source: CryptoQuantRelated: Bitcoin Coinbase Premium threatens bear flag repeat with BTC price at $76KBitcoin needs fresh demand from leveraged tradersBitcoin researcher Axel Adler Jr. highlighted a shift in liquidation pressure, with the seven-day oscillator turning positive and reaching +28.7 by April 30. Both the long and short positions have been squeezed more frequently, with total crypto liquidations reaching $604 million over the past 24 hours.  Bitcoin futures long-short liquidations dominance. Source: CryptoQuantThe shift supports the price in the near term. The 30-day average remains slightly negative, keeping the broader bias tied to prior long liquidations.Open interest shows where traders’ urgency may be lacking. The seven-day average dropped to about 292,000 BTC from above 300,000 BTC. Around 8,000–9,000 BTC in leverage has been removed over the past 10 days, with daily changes still negative.The price continues to press against $77,000, with no rise in participation. A stronger move higher would likely require open interest to increase and spot volumes to expand, signaling new capital entering the market rather than futures positions being forced to close.Related: Bitcoin analysts explain why BTC price can’t take out $80KThis article is produced in accordance with Cointelegraph’s Editorial Policy and is intended for informational purposes only. It does not constitute investment advice or recommendations. All investments and trades carry risk; readers are encouraged to conduct independent research.

Čítaj viac
Bitcoin’s $75K cost basis emerges as key support zone for current bull trend

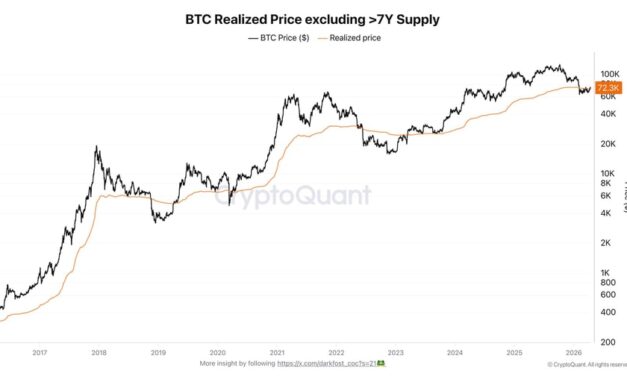
Bitcoin (BTC) is trading at $76,350, which is above several key investors’ cost-basis levels. The one-to-three-month holder average sits at $75,620, placing a large share of recent buyers near breakeven, while the price sits just below the US spot exchange-traded fund (ETF) cost basis of $76,700. The short-term holder (STH) cost basis and the adjusted realized price extend on either side of this range, increasing the importance of the $75,000 level as a near-term support pivot. BTC cost basis cluster tightens near $75,000The one-to three-month holder cohorts share an average cost basis of $75,620. That level capped the price earlier in March when BTC fell to $62,000 from $75,600 in two weeks, but now it aligns as a potential support pivot.BTC realized price excluding more than a seven-year supply. Source: CryptoQuantBitcoin has also closed above the adjusted realized price at $72,300. This metric tracks the average acquisition cost of circulating supply, excluding coins held for more than seven years. A move above it places a large share of investors above the break-even level. Crypto analyst Darkfost noted that a weekly close above the adjusted realized price on April 19 signaled stronger long-term investor conviction in Bitcoin. The analyst added, “A truly bullish signal would be for Bitcoin to start building a standard deviation above this average cost basis, pushing more investors into profit and encouraging them to hold due to increased conviction.”US spot ETF positioning adds an institutional cost basis level. The weighted average cost basis of US spot Bitcoin ETFs sits near $76,700, placing the price close to a key area of recent institutional accumulation. The short-term holder’s cost basis is near $81,800, a level at which investors could build more conviction if the price holds above it. Bitcoin cost basis for STH, US ETF, and LTH. Source: CryptoQuantTogether, these overlapping cost bases compress around $75,000, concentrating both realized and unrealized positioning in a narrow price range. This clustering increases price sensitivity to flows near this level, making it a key support zone.Related: Bitcoin eyes $75K after ‘most hawkish’ FOMC as oil hits highest since 2022BTC liquidity bands outline the near-term rangeWith the support level established at $75,000, the derivatives data outlines a tight liquidity corridor. Cumulative long liquidation risk nears $74,000, with roughly $2.69 billion at risk, while short liquidations near $80,000 total about $4.48 billion. Bitcoin exchange liquidation map. Source: CoinGlassA recent swing between $77,873 and $74,868 on Wednesday cleared $494 million in positions, including $347 million in longs.Crypto analyst CW said the high-leverage longs have been reduced, while a larger pool of short liquidations sits above $80,000. The $74,000 to $80,000 band continues to anchor positioning, with both sides clustering around key cost-basis levels.Related: Most crypto investors believe Bitcoin is undervalued: Coinbase surveyThis article is produced in accordance with Cointelegraph’s Editorial Policy and is intended for informational purposes only. It does not constitute investment advice or recommendations. All investments and trades carry risk; readers are encouraged to conduct independent research.

Čítaj viac
Bitcoin falls as traders cut risk ahead of FOMC: Will TradFi, spot ETF volumes bolster $70K support?

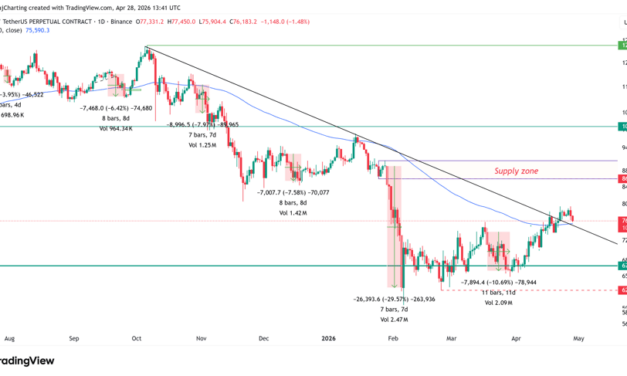
Bitcoin (BTC) fell from its local high at $79,500 as traders repositioned ahead of the Federal Open Market Committee (FOMC) meeting on Wednesday.Historical data shows that since the start of 2025, BTC has corrected seven out of 10 times after an interest rate cut.Bitcoin’s reaction to interest rate cut decisions in 2025 and 2026 shows a clear pattern. The price often moved higher in the days before the meeting, followed by negative returns afterward, as illustrated in the chart.BTC price reaction post FOMC meet. Source: Cointelegraph/TradingViewThe seven-day returns ranged from +6.92% to –29.57% across 10 FOMC meetings.BTC 7-day reaction after FOMC (visual heatmap table). Source: CointelegraphOver the past two years, the post-FOMC price action has been driven less by the rate outcome and more by shifts in liquidity and leverage conditions.During the Jan. 29–Feb 5 drawdown, when BTC fell roughly 30%, derivatives data highlighted the extent of this dynamic. Futures open interest declined sharply, falling to $49 billion from around $61 billion over the course of a week, signaling an aggressive unwind of leveraged positions.This deleveraging phase triggered an estimated $2.5 billion in BTC-specific liquidations, with total crypto liquidations reaching $4.5 billion over the same period.MN Capital founder Michael van de Poppe said that the setup was typical pre-FOMC behavior from the traders. The view frames the pullback as a routine correction tied to the policy uncertainty, with van de Poppe adding,“It almost always happens prior to the event, as there’s still a lot of fear for FED policies from the markets.”The analyst noted that as long as the price holds above $73,000, the higher range may remain intact in the near term.Related: Three Bitcoin charts say BTC price may rally toward $82KStrategy buying BTC offsets the weak sentimentWhile short-term price action reflects caution around macro events, the broader demand picture suggests a strong structural bid beneath the market.Corporate BTC accumulation continues to play a key role. Strategy has significantly expanded its Bitcoin holdings in 2026, increasing its total balance to 818,334 BTC from 672,497 on Jan. 1, adding 145,837 BTC.The purchases are partly funded through Stretch (STRC) offerings, in which the firm raises capital via equity-linked instruments and allocates the proceeds to Bitcoin.Strategy BTC holdings in 2026. Source: bitcointreasuries.netBitcoin macro researcher Ecoinometrics noted that the pace mirrors the late-2024 accumulation, though current conditions are less bullish.At the same time, spot Bitcoin ETF flows have turned positive again, with roughly $3.5 billion in net inflows over the past two months. This resurgence signals renewed institutional participation, even as the short-term sentiment remains cautious.BTC is finding support at key price levels. Source: Cointelegraph/TradingViewSince March, the return of institutional demand for BTC has coincided with the crypto asset forming support levels at key price ranges, such as $60,000, $65,000 and $70,000. While macro-driven events like the FOMC continue to trigger short-term volatility and risk-off behavior, this underlying demand base is helping cushion deeper drawdowns and support a more resilient long-term market structure for Bitcoin.Related: Bitcoin price drops below $76K as onchain data sends mixed signalsThis article is produced in accordance with Cointelegraph’s Editorial Policy and is intended for informational purposes only. It does not constitute investment advice or recommendations. All investments and trades carry risk; readers are encouraged to conduct independent research.

Čítaj viac

Most crypto investors believe Bitcoin is undervalued: Coinbase survey

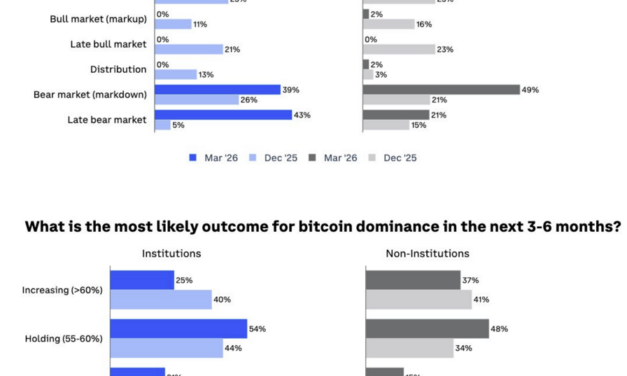
More than 70% of crypto investors believe that Bitcoin (BTC) is undervalued, according to a recent Global Investor Survey conducted by Coinbase and Glassnode.The survey found that 82% of institutions and 70% of non-institutions classify the market as a late bear cycle markdown phase, while onchain indicators suggest BTC is entering a “value-accumulation zone.” Bitcoin is in a late bear phase as undervaluation persistsCoinbase Institutional Research surveyed 91 global investors between March 16 and April 7, including 29 institutions and 62 non-institutions. The responses show a sharp shift in perceptions for the current BTC market. Around 82% of institutions and 70% of non-institutions now classify the market as a late bear or a markdown phase, up from roughly one-third in December.Bitcoin investor survey data. Source: CoinbaseAt the same time, the valuation views held steady. About 75% of institutions and 61% of non-institutions consider Bitcoin undervalued. Only a small share flagged it as overpriced.The survey also noted a shift in expectations for Bitcoin dominance. The share of institutions expecting dominance to rise dropped to 25% from 40%. About 54% now expect it to remain near the current level of 58.1%, while 21% expect a decline. Related: Bitcoin, stocks risk ‘months’ of losses as Kevin Warsh Becomes Fed chairOnchain signals flag value zone for BitcoinOnchain data echo the valuation stance for Bitcoin. Crypto analyst Woominkyu’s Bitcoin Combined Market Index (BCMI) aggregates MVRV, NUPL, SOPR, and investor sentiment into a single reading. The index recently jumped to 0.37 from 0.26, a level historically linked with deep undervaluation phases.Bitcoin Combined Market Index. Source: CryptoQuantThe MVRV compares market value to realized value, while NUPL tracks net unrealized profit and loss across holders. The SOPR measures whether coins are sold at a profit or a loss. Combined, the indicators frame both the pricing and investor behavior from a single viewpoint. The BCMI’s 90-day average continues to trend downward, suggesting ongoing selling pressure. However, earlier this month, Woominkyu said,“We are entering a “Value-Accumulation Zone.” The data suggests the downside is becoming limited compared to the long-term upside.”The short-term holder activity adds context. The realized cap UTXO age bands for one-week to one-month holders fell to 3.91%, matching October 2023 levels when BTC traded near $27,000. This metric tracks the share of recently moved coins, acting as a proxy for short-term liquidity and price speculation.Historically, Bitcoin has formed cycle lows within three to six months of similar readings since 2021. Market analyst Crypto Dan noted in March that the indicator has dropped significantly, placing the BTC market near undervalued territory without confirming a final bottom. Bitcoin realized cap: UTXO age bands (1 week to 1 month). Source: CryptoQuantRelated: Bitcoin’s recent rally is largely fueled by Strategy purchases: Bitwise’s HouganThis article is produced in accordance with Cointelegraph’s Editorial Policy and is intended for informational purposes only. It does not constitute investment advice or recommendations. All investments and trades carry risk; readers are encouraged to conduct independent research.

Čítaj viac

Získaj BONUS 8 € v Bitcoinoch

nakup bitcoin z karty

Registrácia Binance

Burza Binance

Aktuálne kurzy