
Autor Cointelegraph by Biraajmaan Tamuly

Bitcoin falls under $80K but four-month high in weekly BTC ETF inflows may curb selling

Bitcoin (BTC) price dropped to $79,800 on Thursday after being rejected at a key dynamic resistance level. The pullback occurred despite the weekly spot Bitcoin exchange-traded fund (ETF) inflows surging past $1 billion for the first time since January, but technical data suggests the correction may be short-lived. Bearish divergences point to where BTC price may goBitcoin’s dip below $80,000 came amid a bearish divergence in the relative strength index (RSI) on the one-hour and four-hour charts. A bearish divergence occurs when BTC forms higher highs while the RSI weakens across lower timeframes, signaling fading buying momentum during a rally.BTC/USDT, four-hour chart. Source: Cointelegraph/TradingViewA hold above the weekly open at $78,500 could stabilize the short-term price action. The key technical support range remains between $76,000 and $78,000, where the daily fair value gap (FVG) aligns with Bitcoin’s 200-day exponential moving average (EMA). If the correction continues, BTC could retest the FVG zone before attempting another rebound above its recent high at $82,800.A fair value gap marks an area where a sharp price movement previously occurred with limited trading activity, leaving an imbalance that often becomes a liquidity zone during retracements.Crypto trader Jelle said the “200-day MA/EMA cluster” was acting as resistance, while also identifying $78,000 as the first major support area. According to Jelle, a 200-day moving average retest could allow Bitcoin to retest higher price targets.Meanwhile, crypto trader Killa XBT identified the $76,300 to $74,700 range as a deeper support zone if selling pressure continues. The trader pointed to the weekly open near $78,500 as the main short-term level that bulls are attempting to defend. BTC one-day chart analysis by Killa. Source: X Related: Bitcoin analysts say this level must break for BTC price to confirm bottomCan spot ETF inflows offset price weakness?Spot Bitcoin ETF demand strengthened sharply this week. Net inflows reached $1.05 billion, marking the strongest weekly intake since the third week of January. A positive close on Friday would confirm the largest weekly ETF inflow return in nearly four months.Spot BTC ETF net inflows. Source: SoSoValueMeanwhile, Swissblock data shows that the Bitcoin Risk Index has reset to near zero, while ETF net flows turned positive again at roughly 3,000 BTC. Historically, elevated risk readings aligned with the ETF outflows and heavier selling pressure across the market. Risk index and BTC ETF net flows. Source: Swissblock/XThe resets into the low-risk zone often coincided with renewed accumulation near the major support clusters. The analysis added, “That synchronization is still in place. Even when the Risk Index ticked slightly higher last week, ETF selling appeared briefly, but accumulation quickly resumed. That tells us ETF demand is absorbing selling pressure. This remains a flow-driven breakout.”Related: Bitcoin market dominance moves above 61%: Will altcoins follow?This article is produced in accordance with Cointelegraph’s Editorial Policy and is intended for informational purposes only. It does not constitute investment advice or recommendations. All investments and trades carry risk; readers are encouraged to conduct independent research.

Čítaj viac
Bitcoin market dominance moves above 61%: Will altcoins follow?

Bitcoin dominance climbed to 61% on Wednesday, its highest level since November 2025. The metric has risen from 58.44% at the start of April, proving that the bullish trend continues to favor BTC over the wider crypto market.In the last two months, altcoin volumes on Binance also increased by 49%, while 12.6% of altcoins on Binance reclaimed their 200-day simple moving average (SMA). Bitcoin dominance, one-week chart. Source: Cointelegraph/TradingViewAltcoins show early signs of recoveryCrypto analyst Darkfost said Bitcoin has gained 36% since its Feb. 6 lows at $60,000, helping push its dominance to 61.3%. While altcoins spent much of that period under pressure, TOTAL3, which tracks the crypto market cap excluding Bitcoin and Ether, rose by 17% to a two-month high of $765 billion. The recovery pace of altcoins lagged behind BTC, but several indicators have started to improve.TOTAL3, one-week chart. Source: Cointelegraph/TradingViewData from CryptoQuant showed that trading activity in the altcoin market was slowly increasing. Their volume share on Binance climbed to 49% on Wednesday, up from 31% in March, when measured against the combined BTC and ETH futures trading volumes. The rise points to growing participation outside of Bitcoin and Ether after several months of capital concentration in the two largest crypto assets.Darkfost added that the shift still looks moderate and sits far from the aggressive rotation phases seen during the previous altcoin rally in 2024. Altcoin dominance by volume. Source: CryptoQuantRelated: Zcash price may hit $800 as $2.7B hedge fund reveals ‘significant position’ in ZECExchange volume trends point to a rotationMarket analyst CW8900 pointed to the rising activity on centralized exchanges (CEX) as another sign of improving participation beyond Bitcoin. According to the analyst, altcoin trading volume, excluding the five largest cryptocurrencies, has increased steadily over the past few weeks.CEX volume ratio vs Top 5 crypto. Source: CryptoQuantThe 90-day AltSeason Index also climbed to 28.6, its fastest recovery in months. The index tracks whether a majority of altcoins outperform Bitcoin over a set period. Readings above 75 are associated with stronger altcoin cycles. However, CW8900 added, “The indicator also shows that there was no real AltSeason in this cycle. The period when the AltSeason Index reached its highest point was early 2024, and even that value was relatively low compared to previous AltSeasons.”CryptoQuant data also showed improvements across the altcoin market after months of heavy underperformance against Bitcoin. The average altcoin now trades 23.47% below its 200-day simple moving average, rising from 44.4% earlier in the cycle. Similar readings previously appeared near the end of late-stage bear markets in 2022.Altcoin performance, on average, relative to the 200-day SMA. Source: CryptoQuantRelated: Crypto Fear and Greed Index turns neutral for first time since January: Is $100K BTC next?This article is produced in accordance with Cointelegraph’s Editorial Policy and is intended for informational purposes only. It does not constitute investment advice or recommendations. All investments and trades carry risk; readers are encouraged to conduct independent research.

Čítaj viac
Bitcoin short liquidations push BTC to multi-month highs: Is $90K next?

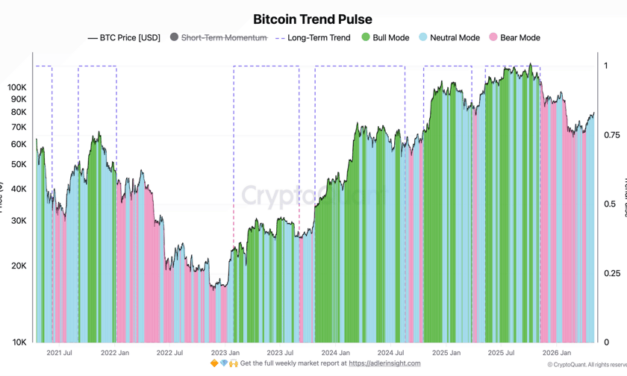
Bitcoin (BTC) may have a clear path to $90,000 after $7.9 billion in short liquidations in February put pressure on the bears. Data show liquidations came in three waves that extended from February through April. The liquidations highlight a growing imbalance as BTC traders continue to build short positions above $80,000, while the price holds firm, creating repeat conditions for future short squeezes.Repeat short squeezes pressure bearsBitcoin researcher Axel Adler Jr. tracked over $7.9 billion in forced short liquidations since early February. The largest spike hit $737 million on Feb. 13, followed by multiple waves through March and April. The liquidation volumes ranged from $2–28 million per day before jumping back to $175 million on May 4. That spike came during a quiet week, pointing to renewed short exposure near $80,000. The pattern shows consistent reloading of bearish positions at higher levels.Bitcoin trend pulse. Source: Axel Adler Jr.The trend pulse data adds context to this behavior. The model moved from bear mode into neutral mode in early April. The short-term momentum has turned positive, while the long-term trend awaits confirmation from a bullish crossover of the 30-day and 200-day simple moving averages (SMAs). Axel Adler Jr. said each major liquidation wave formed while the trend pulse sat in neutral mode, a transition phase after bear mode without a full bullish confirmation. The largest spikes all occurred during this phase. The price was effectively at a crossroads, while traders kept adding short positions. That pattern shows repeated strength fading, followed by forced liquidations, creating pressure that can extend higher if current levels hold above $80,000-$81,500. Related: Bitcoin price nears $82K as ‘big level’ sparks warning of fresh macro rejectionBTC price holds key breakout zone above $80,000Market analyst Coin Niel pointed to continued BTC exchange outflows, with net flows of -837 BTC on May 5. The move signals ongoing accumulation, though smaller than the -6,590 BTC outflows on Monday, keeping the spot sell pressure limited.Bitcoin open interest on all exchanges. Source: CryptoQuantFunding rates hold near -0.0045, suggesting longs are not crowded while the short-side pressure remains active. BTC open interest climbed 6% to $29 billion, its highest level since Jan. 31, increasing sensitivity to large price swings. The BTC price action has turned constructive after Bitcoin broke above a descending trendline that capped rallies through April. The 100-day exponential moving average (EMA) now sits just below the price, acting as dynamic support. BTC is also holding near $81,500, aligned with the short-term holder cost basis, a key level that keeps recent buyers in profit, and may further reduce selling pressure. BTC/USDT on the one-day chart. Source: Cointelegraph/TradingViewThe upside range of $86,000 to $90,000 aligns with a prior supply zone, where sellers stepped in and halted the recovery. This area marks a cluster of past selling activity, with relatively fewer resistance levels before it. Below, the $76,000–$78,000 range serves as the first demand zone, supported by recent activity and a developed daily fair-value gap from last Friday. Crypto trader KriptoHolder noted that liquidation clusters are shaping the near-term direction. The short liquidations sit around $81,000–$82,000, while a larger pool of long exposure rests between $77,000 and $78,000. Data indicates $1.12 billion in cumulative shorts are at risk near $82,500, compared with over $4.2 billion in long positions facing liquidation near $77,000, defining a tight liquidity imbalance.Related: Bitcoin short-term cost basis approaches profitability, but $80K must flip to support firstThis article is produced in accordance with Cointelegraph’s Editorial Policy and is intended for informational purposes only. It does not constitute investment advice or recommendations. All investments and trades carry risk; readers are encouraged to conduct independent research.

Čítaj viac
Crypto Fear and Greed Index turns neutral for first time since January: Is $100K BTC next?

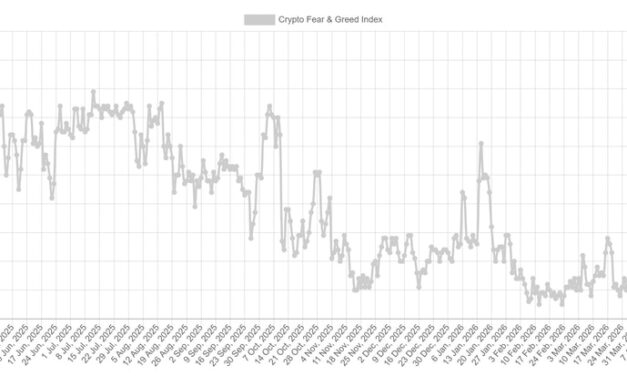
The Crypto Fear and Greed Index hit 50 on Tuesday, measuring “neutral” for the first time since Jan. 17. This shift ended a 108-day stretch dominated by negative sentiment. The index gauges market sentiment using volatility, momentum, trading volume, and social signals. A score below 25 signals “extreme fear” or risk aversion, while 26–49 reflects cautious positioning or “fear,” with higher readings indicating improving investor confidence. Crypto Fear and Greed Index. Source: Alternative.meThe index’s move to 50 marks its first neutral score since mid-January and follows a steady recovery in the total crypto market capitalization, which rose 5.45% in May. Since March, the market has expanded by 16.51%, climbing to $2.66 trillion from $2.28 trillion.TOTAL market cap on the one-month chart. Source: Cointelegraph/TradingViewThe positive shift in sentiment aligns with Bitcoin’s attempt to stabilize above the $81,000 level. Crypto analyst Darkfost noted that BTC sentiment is turning more constructive as the price tests higher levels. The analyst added that a separate sentiment index, ranging from -100 to +100, has also edged into the greed zone. This indicates that investor confidence is improving, with a growing preference to hold BTC rather than exiting positions.Bitcoin unified sentiment index. Source: CryptoQuantJanuary showed a similar shift in sentiment before the momentum faded. Darkfost pointed to the current phase as a potential pivot, with investor behavior shaping the next move.Related: Bitcoin ‘supercycle’ or a bear market rally? BTC breaking $81K has traders at oddsStablecoin outflows may stall momentum Binance stablecoin netflows have recorded a cumulative outflow of $11.8 billion since April 25. This metric tracks the movement of stablecoins into and out of the exchange and is often used as a proxy for available buying power.Positive net flows signal capital entering the exchanges, often associated with accumulation. A negative net flow indicates capital leaving, which can reduce liquidity for spot crypto purchases.Binance stablecoin netflows. Source: CryptoQuantRecent data shows a sustained drainage phase, with daily outflows exceeding $1.5 billion across multiple sessions. Earlier in April, Binance saw consistent inflows as Bitcoin climbed from $74,000 toward $78,000. That inflow cycle has now reversed.Market analyst Crazzyblockk noted that the earlier buildup of stablecoin reserves helped fuel the upward movement. The current outflow trend suggests this pool of deployable capital has thinned in the short term, potentially tempering the bullish momentum for BTC and other crypto assets. Related: Crypto products post 5th straight week of inflows despite mid-week selloffThis article is produced in accordance with Cointelegraph’s Editorial Policy and is intended for informational purposes only. It does not constitute investment advice or recommendations. All investments and trades carry risk; readers are encouraged to conduct independent research.

Čítaj viac

Bitcoin short-term cost basis approaches profitability, but $80K must flip to support first

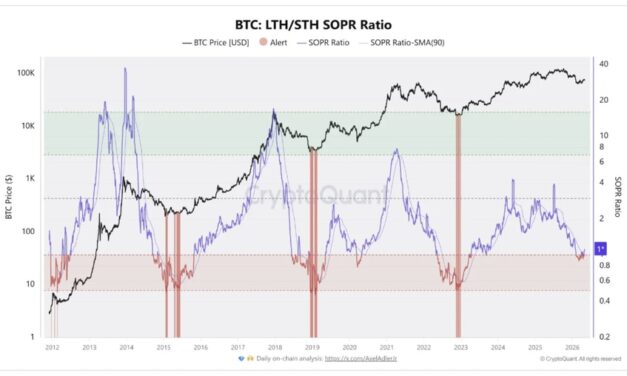
Bitcoin (BTC) reached a new three-month high of $80,500 on Monday, testing the level for the first time since Jan. 31. The rally above $80,000 puts the price just below short-term holders’ cost basis of $81,486, the next dynamic resistance level. For the rally to continue, a daily close above this level is key to securing $80,000 as support. A rally to $81,500 may lock in the trendBitcoin’s rally to $80,000 places the price directly under the short-term holder’s realized price of $81,486. This metric reflects the average cost of coins moved over the last 155 days and indicates where recent buyers have flipped from loss to profit.A daily close above $81,500 would return these holders to profit and reduce sell-side pressure. According to crypto analyst Crazyyblockk, the short-term holder losses have narrowed to about -2.17%, showing that the overhead supply band is thinning. The long-term holders (LTHs) hold near +27% profit and are not distributing aggressively.Bitcoin LTH/STH SOPR ratio. Source: CryptoQuantThe spent-output profit ratio (SOPR), which tracks whether coins are spent at a profit or a loss, has climbed to 1.097 from 0.99. This indicates the coins are being spent in profit again, led by long-term holders. The exchange inflow data aligns with that shift. Around 97.2% of recent deposits came from short-term holders, with wallets holding 1 to 1,000 BTC contributing roughly 58%.BTC inflows peaked at 35,649 BTC on April 24 and dropped to 3,895 BTC by May 3. That compression reduces immediate sell pressure and supports the case for holding at $80,000 once the cost basis flips.Related: Bitcoin in ‘disbelief rally’ as traders spot $84K BTC price targetBTC exchange supply builds below $80,000BTC exchange flow data tracked by Bitcoin researcher Axel Adler Jr shows 8,512 BTC in net inflows over recent days, with spikes on April 27 and April 30. The price absorbed that supply without a sharp downside, signaling an active BTC demand.Bitcoin exchange netflows for all exchanges. Source: CryptoQuantThe BTC flows have since cooled to near-neutral at 269 BTC between May 1 and May 3. The short-term averages stay positive, while the longer-term averages sit near zero, keeping the move contained to a short impulse.BTC exchange reserves increased by 5,773 BTC week over week to 2,685,541 BTC, before easing slightly after April 30. Adler Jr explained that the coins are currently sitting on exchanges without aggressive selling, forming a supply overhang that could turn into pressure if demand slows.Meanwhile, crypto trader Ardi highlighted that BTC is retesting breakout liquidity near $79,600. The trader said that holding this level keeps the move intact toward the next supply zone near $84,000. BTC/USDT analysis by Ardi. Source: XA breakdown below $80,000 shifts focus to the new-money cost basis near $76,500 and increases the likelihood of a failed breakout setup.Related: BTC price can ‘easily’ hit $95K: Five things to know in Bitcoin this weekThis article is produced in accordance with Cointelegraph’s Editorial Policy and is intended for informational purposes only. It does not constitute investment advice or recommendations. All investments and trades carry risk; readers are encouraged to conduct independent research.

Čítaj viac

Získaj BONUS 8 € v Bitcoinoch

nakup bitcoin z karty

Registrácia Binance

Burza Binance

Aktuálne kurzy