Autor Cointelegraph by Biraajmaan Tamuly

Bitcoin traders expect ‘fast move’ to $90K following CLARITY Act vote

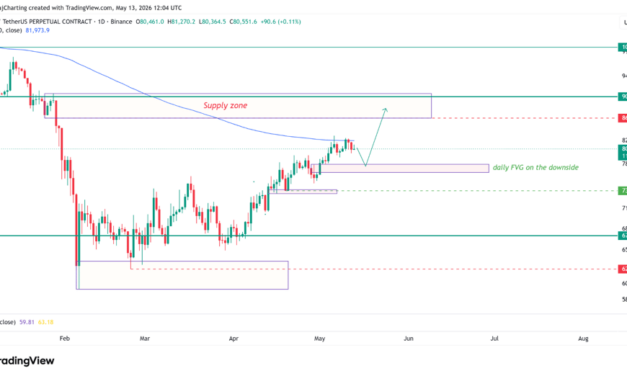
Bitcoin (BTC) traders expected a quick move toward $90,000 after the upcoming CLARITY Act vote on Thursday, as improving market conditions and easing short-term sell pressure support an upside move.  Bitcoin market signals potential breakout above $80,000Bitcoin has traded around the $80,000 level over the past week, while the 200-day exponential moving average (EMA) remains key overhead resistance. More than $3 billion in leveraged long positions are clustered between $79,000 and $78,000, suggesting BTC could briefly retest that range before attempting another breakout above the 200-day EMA. BTC/USDT, one-day chart. Source: Cointelegraph/TradingViewMN Capital founder Michaël van de Poppe remained bullish and said,“If this continues to grind upwards, with the upcoming CLARITY Act tomorrow, I would assume we might see a fast move to $90K in a matter of days for Bitcoin.”Onchain data also points to improving market conditions. Bitcoin researcher Axel Adler Jr. said short-term holder loss pressure has remained at zero percent for five straight days. This metric measures whether recent Bitcoin buyers are holding BTC below their purchase price.Adler Jr. also noted that the share of Bitcoin supply held by short-term traders dropped to 22.2%, its lowest level in 90 days. This suggests that less recently bought BTC is being sold, which could boost the chances of a breakout.Bitcoin STH loss pressure (%). Source: Axel Adler Jr.However, crypto trader Zord warns that Bitcoin could face resistance between $83,400 and $84,600 after reclaiming the 50% Fibonacci retracement level near $78,983. According to the chart, the $83,400–$84,600 range is the next Fibonacci resistance zone of 0.618-0.65, where traders may begin taking profits and slow Bitcoin’s rebound.BTC/USD one-day chart analysis by Zord. Source: XRelated: Bitcoin to $100K in Q2? Strategy’s STRC unlocks potential to buy 3K BTC in two daysCLARITY ACT vote draws market attentionThe CLARITY Act is a proposed US bill that would set clearer rules for how regulators oversee the crypto market and stablecoins. As Cointelegraph reported, members of the US Senate Banking Committee submitted more than 100 amendments to the bill ahead of Thursday’s discussion. Most of the proposed changes focus on stablecoins, crypto developers, and ethics-related concerns.A version of the bill leaked on Monday suggests that crypto exchanges and other platforms may no longer be allowed to offer stablecoin rewards that work like interest from a traditional savings account.Crypto research firm XWIN Japan said the proposal appears aimed at separating stablecoins used for payments from products that behave more like bank deposits.Stablecoin ERC20 active addresses. Source: CryptoQuantMeanwhile, stablecoin activity and adoption have continued to rise across crypto networks. For example, ERC-20 stablecoin active addresses have been seeing parabolic growth in recent years. XWIN Japan added that stablecoins remain the main source of money moving through crypto markets, and wider adoption of stablecoins and blockchain-based financial products could support more long-term investment in Bitcoin.

Čítaj viac
Bitcoin may avoid historic bear market losses as ETF flows grow, says analyst

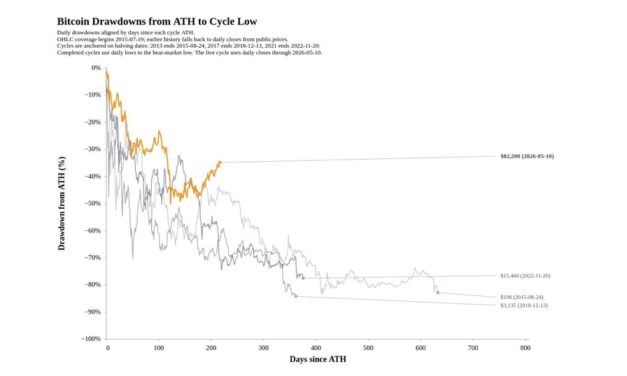
Bitcoin (BTC) is currently down 36% from its all-time high at $126,000, but one analyst claims that BTC’s fourth bear market has “materially decoupled” from previous bearish cycles, due to exchange-traded fund (ETF) inflows and corporate BTC accumulation.Bitcoin ETF flows and treasury buys may limit further downsideBitcoin Bond Company CEO Pierre Rochard compared Bitcoin’s drawdowns across previous market cycles and said the current correction looks different from the past bear markets. The 2013–2015 cycle wiped out roughly 85% of Bitcoin’s value, while the 2017–2018 and 2021–2022 cycles saw declines of nearly 77% before the price bottomed.The current dip has been relatively smaller. Bitcoin fell to around $60,000 from its all-time high near $126,000, marking a decline of about 52%.Bitcoin drawdown analysis across different market cycles by Pierre Rochard. Source: XRochard explained that Bitcoin ETFs have become a new source of demand over the past two years. US-listed spot Bitcoin ETFs have recorded cumulative net inflows of more than $59 billion since launch, including $4.5 billion since March.Corporate Bitcoin buying has also picked up. Strategy increased its Bitcoin holdings to 818,869 BTC from 640,031 BTC in October 2025, adding nearly 179,000 BTC. The company’s average purchase price is around $75,543.Strategy BTC holdings. Source: bitcointreasuries.netAccording to Rochard, ETF investors and corporate treasury firms are now providing consistent demand that did not exist during the 2018 and 2022 bear markets.MN Capital founder Michaël van de Poppe agreed that the current market environment no longer resembles the 2022 cycle. Van de Poppe said,“The most overcrowded thesis right now is that Bitcoin makes a bear flag and that we’re going to bottom out in October ’26.”Van de Poppe pointed to several factors that make this cycle different, including fresh Nasdaq highs at 29,372 on Monday, the upcoming legislative vote on the CLARITY Act, discussions around a strategic Bitcoin reserve, and the appointment of a new Federal Reserve chair.Related: Bitcoin funding rates turn positive: Is BTC rally to $85K next?BTC retail demand starts recoveringCrypto analyst MorenoDV noted that Bitcoin recently flashed its first “early bull” signal since March 2023 using CryptoQuant’s Bull-Bear Market Cycle indicator. The indicator tracks whether the market is shifting toward a bullish or bearish phase by analyzing price momentum and moving averages.Bitcoin bull-bear market cycle indicator. Source: CryptoQuantMorenoDV said similar signals appeared in 2019 and early 2023 before Bitcoin rallied 1280% and 461%, respectively. However, the latest signal still needs stronger price confirmation. MorenoDV said,“Several other market metrics are already showing signs of exhaustion. That makes this signal less clean than a classic early-cycle confirmation.”Onchain data also showed signs that smaller investors are returning to the market after activity dropped throughout April. Bitcoin researcher Axel Adler Jr. tracked the 30-day change in Bitcoin transaction volume from wallets holding between $0 and $10,000, which is often used to measure the retail investor participation.Bitcoin retail investor demand. Source: Axel Adler JrThe metric dropped to -8.2% on April 5 before recovering into positive territory later in the month. It reached 6.31% on May 6 and remained near 4.38% on May 12 while Bitcoin traded at $80,625.The retail transfer volume increased slightly to $351 million from $336 million in mid-April. However, Adler Jr. said the activity remains below February levels, when volumes ranged from $365 million to $375 million. As Cointelegraph reported, there are increasing signs that the early stages of a new bull market are underway. Related: Strategy resumes Bitcoin acquisitions with $43M BTC buy

Čítaj viac

Ether price is still stuck below $2.4K: Here is why

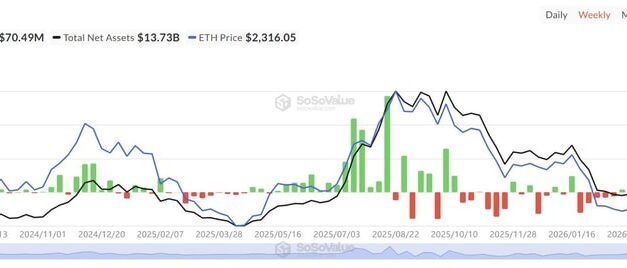
Ether (ETH) has tested the $2,400 resistance five times over the past month, with each breakout attempt losing momentum near that level. The stalled price action comes as spot Ether exchange-traded funds (ETFs) recorded just $500 million in inflows since March. Ether reserves on Binance exchange climbed by 400,000 ETH, and ETH futures traders also reduced leverage exposure over the past week.Weak spot ETF demand limits upsideSpot Bitcoin ETFs attracted roughly $4.5 billion in net inflows since March, supporting BTC’s move above $82,000. Ether ETFs recorded only $500 million in inflows during the same time period, leaving ETH without the same level of institutional buying pressure.That demand gap matters because Ether has repeatedly tested the same resistance zone without fresh spot demand entering the market. Spot ETH ETF net inflows. Source: SoSoValueCrypto analyst Darkfost noted that ETH futures activity initially supported the recovery. Ethereum open interest increased by $4.5 billion during its 33% recovery from the February low of $1,736, indicating that traders aggressively added positions as the price rallied. Binance’s estimated leverage ratio also rose to 0.76 on March 16, one of the platform’s highest readings this year, signaling that traders were using more borrowed capital to increase futures exposure. The leverage trend has since reversed near the resistance level. Binance’s estimated leverage ratio dropped to 0.57 on Sunday. The analyst explained that long positions opened ahead of a breakout were closed after ETH slipped back below $2,350.Ether: estimated leverage ratio on Binance. Source: CryptoQuantLower leverage reduces the possibility of sharp liquidations driving the price higher. Darkfost added, “This is not necessarily a bearish signal. Lower leverage tends to stabilize the market, especially as ETH attempts to break out of its range. Now, for a breakout to materialize, spot demand will need to take over.”Related: Veteran investor bets on Ethereum as AI agents drive tokenization demandEther inflows to Binance raise supply pressure Market analyst Rei noted a sharp increase in Binance ETH reserves in May. According to the analyst, Binance reserves rose to 3.8 million from 3.4 million ETH. Meanwhile, the total exchange inflows on Binance peaked at 771,689 ETH on Sunday. Ether exchange reserve on Binance. Source: CryptoQuantThis is the highest level of exchange inflows since Feb. 6, when 1.1 million ETH were recorded on Binance. The ETH deposits arrived while ETH traded around $2,330, consolidating in a tight range between $2,400 and $2,250 since April 14. Ether exchange inflow. Source: CryptoQuantThe analyst said that large exchange inflows may coincide with traders preparing new positions or taking profits during the price rebound. The added liquidity increases the available supply near the resistance and puts greater pressure on ETH buyers attempting to reclaim $2,400.For ETH bulls, the immediate task remains turning $2,400 from resistance into support. Without stronger spot demand or a reduction in exchange-side supply, that zone may continue to cap rallies in the near term.Related: Ether down 35% versus Bitcoin in a year: Will the ETH price downtrend continue?

Čítaj viac

Solana ETF inflows show demand returning as traders eye SOL rally to $120

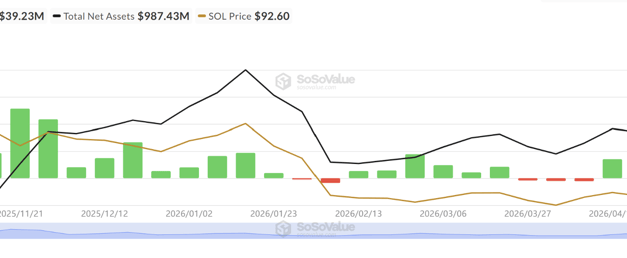
The spot Solana (SOL) exchange-traded funds (ETFs) recorded their strongest weekly performance since February, attracting $39.23 million in total net flows. The surge in capital inflows coincided with SOL futures open interest rising by $1.5 billion in May, signaling a sharp increase in trader positioning across the derivatives markets.The rise in market activity comes alongside Solana’s 15% rally to $97 in the past seven days, with traders targeting the next major resistance level at $120. SOL ETF demand rises with futures interestBitwise’s BSOL ETF led the latest inflow wave with $36 million in weekly net inflows last week, while Fidelity’s FSOL added over $1.8 million. Since its launch, BSOL has attracted $861 million, accounting for nearly 81% of cumulative inflows across all spot SOL ETFs, which now total about $1.06 billion.Spot SOL ETF netflows. Source: SoSoValueFutures activity rose alongside the ETF demand. Solana open interest (OI) climbed to $6.4 billion from $4.94 billion on May 1, marking a 29.5% increase in less than two weeks. Aggregated spot cumulative volume delta (CVD), which measures the net difference between market buy and sell orders, climbed to nearly $250 million from $163 million in five days, during SOL’s push toward $96. The futures CVD expanded to about $593.6 million after rising steadily from May 5 onward, as buyers absorbed sell-side liquidity in both the spot and futures markets. SOL price, aggregated open interest, spot, and futures CVD and funding rate. Source: velo.chartThe funding rate held near 0.065%, indicating traders continued to pay to maintain long exposure. The buying activity has started to flatten near the $95-$96 range as spot and volume deltas have cooled over the past 24-hours. Related: South Korea crypto holdings halve in a year as investors turn to stock marketSolana eyes a breakout: Is $120 next?Solana is forming an Adam and Eve pattern near the $95 resistance level, with the setup’s neckline directly at the current breakout zone. A confirmed move above that level places the technical target near $120. An Adam and Eve pattern on the higher time frame chart could signal a bottom for SOL if price successfully turns the $95 resistance level into support. SOL/USDT, one-day chart. Source: Cointelegraph/TradingViewSOL also pushed above its 100-day exponential moving average for the first time since October 2025, adding another technical shift to the mix alongside ETF inflows and rising futures positioning. A confirmed daily close and consolidation above $95 could open the path toward the pattern’s projected target near $120, due to a lack of resistance sitting between the two levels after the 42% dip in February.Crypto analyst BATMAN noted that Solana recently broke above a 231-day downtrend on the SOL/BTC daily chart, signaling improving relative strength against Bitcoin. According to the analyst, the $89-$91 zone now acts as the nearest support cluster and a likely retest region if SOL holds above the breakout area. SOL/USDT, one-chart analysis by BATMAN. Source: XRelated: XRP metrics line up bull signals for ‘full-scale rally’ to $2

Čítaj viac

Bitcoin exchange reserves fall to two-year low after $8B exodus

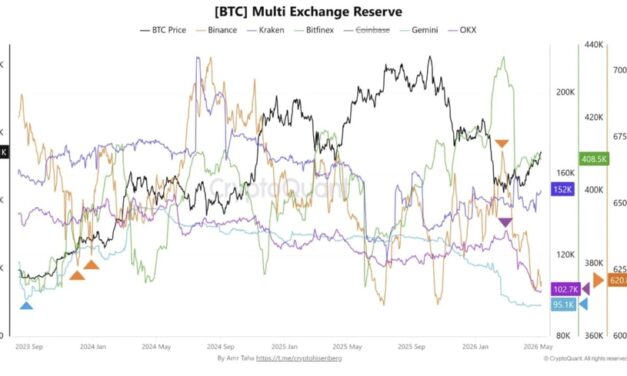
Bitcoin (BTC) reserves on major crypto exchanges have dropped to their lowest level since 2023, with nearly 100,000 BTC withdrawn from Binance, OKX and Gemini in less than three months. The outflows coincided with stronger demand from accumulator addresses, as the cohorts’ holdings have increased by 60.5% over the past two weeks. Bitcoin exchange reserves fall to two-year lowCrypto analyst Amr Taha noted that Bitcoin reserves on Binance, OKX and Gemini have declined sharply since February. Binance recorded the largest drawdown, with reserves dropping to nearly 620,000 BTC on May 7, down from roughly 670,000 BTC on Feb. 21. The decline pushed Binance’s holdings below levels last seen in December 2023.OKX followed the same trend. Its Bitcoin reserve fell to around 102,000 BTC this week, from nearly 132,000 BTC on March 2. Gemini also posted steady outflows, sliding to 95,000 BTC from 114,800 BTC in early February.BTC multi-exchange reserves. Source: CryptoQuantCombined, the three exchanges recorded an outflow of nearly 100,000 BTC, valued at over $8 billion at current prices. Taha noted that a synchronized decline across multiple exchanges carries more weight than isolated outflows from a single exchange. Fewer coins on trading platforms can amplify the price reaction when strong spot demand returns.The move coincides with a shrinking OTC balance. Lower OTC balances can reduce the amount of Bitcoin available for large private transactions outside exchanges. The latest 30-day OTC balance change showed a net decline of 24,940 BTC, while the same metric had risen to nearly 25,300 BTC on Feb. 8 after Bitcoin’s drop toward $60,000. The reversal shows that OTC supply inflows have slowed significantly since the February sell-off. Bitcoin total OTC desk balance. Source: CryptoQuantRelated: Bitcoin Bollinger Bands push key breakout as creator acts on positive signal”Accumulator” demand rises as Binance buyers turn positive Long-term participants increased their Bitcoin accumulation during the latest recovery phase. CryptoQuant data shows demand from accumulator addresses climbed to 264,000 BTC on May 6, up from 164,440 BTC on April 23. The same metric fell to nearly 100,000 BTC on March 15, after peaking above 205,000 BTC on Feb. 5.Bitcoin demand from accumulator addresses. Source: CryptoQuantThe increase in accumulation coincided with Bitcoin’s recovery toward $82,800, indicating stronger buying activity by long-term holders during the recent price advance. Derivatives activity also strengthened during the recent rally. Binance’s seven-day net taker volume moved from approximately -$1 billion (seller-dominated) in late March to +$2.63 billion (buyer-dominated) on Thursday.Binance’s seven-day net taker volume for BTC. Source: CryptoQuantRelated: VanEck’s Sigel sees Bitcoin reaching $1M within five yearsThis article is produced in accordance with Cointelegraph’s Editorial Policy and is intended for informational purposes only. It does not constitute investment advice or recommendations. All investments and trades carry risk; readers are encouraged to conduct independent research.

Čítaj viac

Získaj BONUS 8 € v Bitcoinoch

nakup bitcoin z karty

Registrácia Binance

Burza Binance

Aktuálne kurzy