Autor Cointelegraph by Biraajmaan Tamuly

Bitcoin liquidity balance hints at developing rally toward $80K

A liquidity imbalance in Bitcoin (BTC) is building near $80,000, with more than $4 billion in short positions vulnerable to liquidation above that level. The setup strengthened after Bitcoin defended support near $76,100 for two days and formed bullish signals on the lower time frames. BTC short liquidations stack above $80,000On the one-hour chart, Bitcoin formed a bullish divergence between the price and the relative strength index (RSI), with improving momentum and higher lows near $76,100, suggesting underlying buying strength. BTC also retested $78,000 on Thursday after defending the $76,100 support level multiple times this week.BTC/USDT, one-hour chart. Source: Cointelegraph/TradingViewThe price action is also shaping an inverse head-and-shoulders setup beneath a descending trendline, a structure that often signals weakening bearish pressure before a breakout. A move above $78,000 could expose the fair-value gap (FVG) between $79,500 and $80,300, a low-liquidity price zone created during a sharp prior selloff that BTC price could revisit to fill the untraded range before continuing its next move. CoinGlass liquidation data show that the largest concentration of leveraged risk is above current price levels. A move toward $80,000 would expose more than $4 billion in cumulative short positions. By comparison, a decline toward $75,000 would expose roughly $3 billion in long liquidations.This indicates that short sellers face greater pressure than bullish positions if BTC continues to climb. BTC liquidation map. Source: CoinGlassRelated: Bitcoin accumulation trends weaken as realized losses jump to $600MBitcoin futures activity overshadows spotBTC liquidation activity has already accelerated over the past 24 hours. CoinGlass data recorded 103,963 liquidated traders, with total liquidations reaching $286.08 million. Short positions accounted for nearly $175 million of the total, while the largest single liquidation hit Binance’s BTCUSDT pair at $3.04 million.Open interest in Bitcoin term. Source: CryptoQuantCryptoQuant data showed Bitcoin-denominated open interest near 116,800 BTC, down from 120,000 BTC a day earlier. The lower open interest indicates traders closed part of their leveraged exposure during recent volatility. That usually points to more controlled derivatives activity rather than overheated speculation.Spot market participation stayed weak during Bitcoin’s recovery toward $78,000. The aggregated spot cumulative volume delta (CVD), which tracks net buying and selling pressure, stood at -$483 million. The futures CVD turned slightly positive around $34 million, while funding rates remained elevated, indicating a bullish skew in the short term. BTC price, aggregated funding rate, futures, and spot CVD. Source: Velo chartThe split between weak spot demand and marginally strong futures activity shows leveraged traders are driving the recent upside. The liquidity concentration above $80,000 now stands as the clearest near-term retest level.Related: SpaceX reveals larger-than-expected Bitcoin holdings in IPO filing

Čítaj viac
Key Bitcoin price metric used by bulls falls to six-week low, but there’s a silver lining

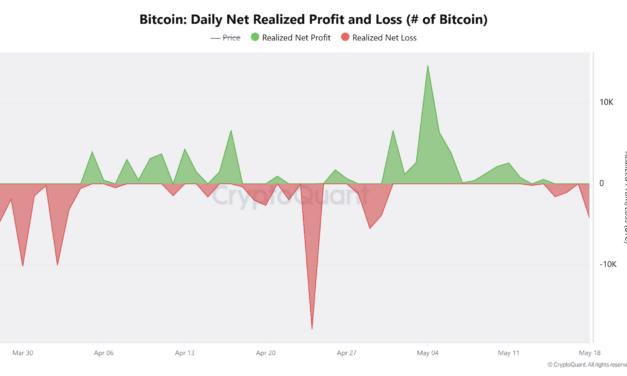
Bitcoin (BTC) demand on Coinbase points to early signs of market stabilization as BTC reclaimed the upper bounds of its range highs. The 14-day trend of the Coinbase Premium Index has remained in an uptrend, suggesting steady buyer interest despite traders taking $1.14 billion in profits, which pushed the daily Coinbase premium to a six-week low. Coinbase demand stabilizes amid negative readingsThe Coinbase Premium Index dropped to -0.087 on May 19, its weakest reading since March 31. A negative premium means Bitcoin traded at a lower price on Coinbase than on Binance, signaling softer demand from US-based buyers.BTC profit-taking accelerated as it rallied to $82,000 and holders realized 14,600 BTC ($1.14 billion) in daily profits on May 4. CryptoQuant noted unrealized profit margins climbed to 17.7% on May 5, the highest level since June 2025. Bitcoin net realized profit and loss. Source: CryptoQuantHowever, the longer-term trend for Coinbase paints a steadier picture. The 14-day simple moving average (SMA) of the premium index has remained above its February lows. Similar recoveries in the moving average preceded renewed spot demand on Coinbase during March 2025, shortly before Bitcoin pushed toward $110,000 in April-May 2025. The daily premium readings still sit below zero, though the rising SMA points to easing sell-side pressure. Bitcoin also continues to hold above the $70,000–$75,000 range, a zone that previously attracted strong spot accumulation.Bitcoin Coinbase Premium 14-day SMA. Source: CryptoQuantCrypto analyst Amr Taha noted that activity across the Coinbase-linked network stayed elevated during the latest pullback. The Base blockchain revenue climbed to nearly $972,000 on May 19, exceeding late-March levels even as the Coinbase Premium Gap remained negative. The divergence highlights steady network participation inside the Coinbase ecosystem while spot demand gradually rebuilds.Daily blockchain total revenue by different protocols. Source: CryptoQuantRelated: This Bitcoin price model targets ‘conservative’ $255K by year-endBTC price receives support from the key daily trendThe daily chart of BTC still leans bullish after the rejection near $82,000. The price continues to trade above the 100-day exponential moving average (EMA) near $76,800, which is acting as key dynamic support.The current retracement has held within the $76,000–$77,000 fair-value gap, keeping buyers active near recent accumulation levels. A recovery from this zone could reopen the path toward $80,000–$82,000, while the larger supply area near $86,000–$90,000 sits higher.BTC/USDT, one-day chart. Source: Cointelegraph/TradingView $74,800 remains a key level and a daily close below that price would mark the first bearish break in the current higher-low formation and shift focus to the $70,000 psychological support level.Futures data continues to support demand resilience. Market analyst CryptoOnChain reported that Bitcoin’s 30-day moving-average net taker volume dropped to $58 million on May 18 from $243 million in April. However, the metric remained positive during the recent correction, indicating that BTC futures buyers continued to absorb sell pressure near the current price.BTC net taker volume. Source: CryptoQuantRelated: Bitcoin sees fresh US sell-off as markets await Nvidia ‘biggest earnings event’

Čítaj viac

Data shows Bitcoin dip buyers waiting for lower prices: Is $70K BTC’s next stop?

Bitcoin (BTC) traders have shifted their focus lower after futures and order book data point to strong buyer interest in the $68,000-$70,000 zone.Sell pressure has increased in the derivatives markets and the daily bid-ask ratio fell to -0.03, showing sellers are currently more aggressive than buyers as traders position around liquidation levels.Bitcoin buyers cluster near $68,000The visible range volume profile (VRVP) indicator shows the $68,000-$70,000 region as the most densely traded zone on the chart since November 2025. High trading activity in that price range suggests most positions were opened near those levels over the past few months.The order book data also shows a bid-ask ratio of -0.03, with the metric remaining in negative territory for most of the past month as sell-side activity continued to outweigh aggressive buying pressure. BTC/USDT price, bid-ask ratio and VPVR profile. Source: HyblockLiquidation data adds another pressure point. The heatmap shows more than $3.4 billion in cumulative long positions exposed near $74,700. The figure rises toward $11 billion if Bitcoin falls to $70,000 across the 90-day liquidation range.Taken together, the positioning data suggests traders are prioritizing deeper liquidity pools rather than chasing higher prices above $80,000.Bitcoin exchange liquidation map. Source: CoinGlassRelated: Bitcoin price stays under $77K as US bond yields near 20-year highsBTC retail longs are crowdedCrypto analytics platform Hyblock noted Bitcoin retail traders are again leaning heavily bullish as its “True Retail Accounts” long percentage metric climbed above 60%. The indicator tracks the share of retail futures accounts holding long positions.BTC/USDT, one-day chart. Source: Hyblock/XPrevious spikes into the platform’s “extreme long” zone aligned with short-term local tops during rallies toward the $78,000-$82,000 range in early May. The price momentum later cooled after retail positioning became too crowded.Hyblock explained that the strongest recovery points appeared when retail traders turned aggressively bearish. Several periods when fewer than 35% of retail accounts held long positions emerged near Bitcoin’s lows in March and April, before BTC rebounded from the mid-$60,000 range.Hyblock combines the retail positioning metric with a 14-period relative strength index (RSI) reading to identify sentiment extremes for BTC.The latest reading shows the TRA Long (%) near 60.7%, while the RSI stayed elevated at 74.9, suggesting retail traders are still positioned for prices near $76,000. This could lead to deeper correction if BTC follows its previous market behavior. Related: Bitcoin miner Canaan posts $88.7M net loss in Q1 amid BTC decline

Čítaj viac

Retail Bitcoin investor demand falls by 73% as futures selling tops $2B: Are the bears back?

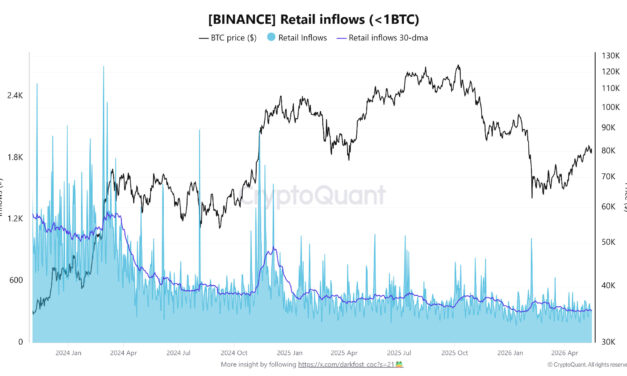
Bitcoin (BTC) retail investor activity on Binance has fallen to its lowest level in history. Retail BTC inflows on Binance now average near 314 BTC per month in 2026, down sharply from the 1,200 BTC range recorded in March 2024.Bitcoin’s recovery in May also slowed as spot inflows on Binance weakened, with the 30-day net demand growth falling 73% over the past three weeks.Bitcoin retail traders step backCryptoQuant analyst Darkfost said retail Bitcoin inflows to Binance remained near its historic lows. The metric tracks BTC deposits from wallets holding less than 1 BTC, a common signal for retail investor activity.Bitcoin retail inflows (less than 1 BTC) on Binance. Source: CryptoQuantMonthly retail BTC inflows on Binance now average just 314 BTC. The figure stood near 1,800 BTC during the 2022 bear market and around 1,200 BTC during Bitcoin’s March 2024 local top near $75,000. Earlier cycles showed far heavier retail participation, with inflows peaking near 5,400 BTC in 2018 and 2,600 BTC in 2021.Darkfost said part of the shift likely stemmed from investors moving toward spot Bitcoin exchange-traded funds (ETFs) rather than directly holding BTC on exchanges.CryptoQuant data also showed a cooldown in retail demand growth. The 30-day change in retail investor demand dropped to 3.12% from 7.39% last week. That earlier reading marked the strongest retail demand expansion since August 2025, when Bitcoin traded near $115,000. The decline points to weaker spot participation after a brief pickup in buying activity. Bitcoin retail investor demand. Source: CryptoQuantRelated: Bitcoin price hits $76K, lowest since April after $1B ETF net outflowBTC spot demand lags behind futures positioning Crypto analyst Amr Taha said Binance recorded two large spikes in Bitcoin taker sell volume during the recent decline. The first reached roughly $1.5 billion on May 15. Another climbed above $1.1 billion as Bitcoin fell below $77,000.Market analyst Crazzyblockk said one important signal still missing from Bitcoin’s recovery is a balanced spot demand. The previous rallies in October 2024, November 2024, and May 2025 showed that spot and futures demand rose together. Spot demand ranged between +97,000 BTC and +190,000 BTC during those price rallies, while the futures demand expanded alongside it.The latest recovery showed a different pattern. BTC futures demand remained positive at +193,000 BTC over 30 days, while spot demand remained negative at -28,000 BTC and stayed below zero for 65 consecutive days. The total 30-day demand growth also fell from 232,000 BTC in early May to 62,000 BTC by May 16, recording a 73% decline.Bitcoin spot and futures demand growth (30-day sum). Source: CryptoQuantCrazzyblockk also pointed to a sharp shift in Binance’s futures dominance last month. Binance previously controlled 40%-44% of global USDT-margined futures volume from October 2024 to March 2026.In May 2026, Binance’s share dropped to 21.1% while OKX climbed to 26.3%, marking the first reversal in exchange leadership during the cycle. Related: Price predictions 5/18: SPX, DXY, BTC, ETH, XRP, BNB, SOL, DOGE, HYPE, ADA

Čítaj viac

Bitcoin’s trend defining battle starts at the $74K support: Analyst

Bitcoin (BTC) lost its hold on the $80,000 level over the weekend, and data suggest that the cryptocurrency needs to trade above the $74,000-$75,000 range, as it has repeatedly served as key support over the last two years. Crypto analyst Ardi said the next retest of the $74,000-$75,000 range could become the most important support test of the current bear market.The analyst pointed to the role that the price range played during the last two years. In 2024, Bitcoin struggled to break above the range during a seven-month-long consolidation. In Q1 2025, the same area held as support before BTC rallied toward its cycle highs at $126,000.BTC/USD, one-day chart analysis by Ardi. Source: XBitcoin is now approaching this level after its 5.78% weekly correction to $77,900. Ardi said the zone carries added weight because several major price pivots formed at $74,000-$75,000 across multiple time frames. Crypto trader Alex Wacy focused on the $70,000 level. Wacy said holding that area could support a move back toward $85,000-$90,000. Losing it could open the door to a larger decline toward the $50,000-$60,000 range.Related: BTC price ‘bull trap’ at $76.5K? Five things to know in Bitcoin this weekBitcoin market signal weakens againBitcoin researcher Axel Adler Jr. said the Bitcoin bull-bear structure index turned bearish again after BTC failed to stay above $82,000 earlier this month.It tracks six indicators linked to exchange-traded fund (ETF) demand, trader activity, exchange flows, and short-term price momentum. A positive reading indicates buyers are in control, while a negative reading points to growing seller pressure.Bitcoin bull-bear structure index. Source: CryptoQuantThe bullish signal lasted less than three trading days. On May 6, the index briefly turned positive as Bitcoin climbed near $82,000. By May 17, the reading had dropped to -23.49, indicating that sellers quickly regained control.Meanwhile, CryptoQuant data showed more Bitcoin moving onto exchanges from investors who bought BTC six to 12 months ago. The average buying price was around $110,851, meaning many are now sitting on large unrealized losses after the latest drop.The share of older coins moving to exchanges also surged to 10.54%, far above its usual level below 1%, with market analyst Easy On Chain stating, “Historically, this reflects investors locking in major losses and exiting the market, creating severe spot-market selling pressure.”Related: Saylor’s Strategy scoops $2B Bitcoin, holdings reach 843,738 BTC

Čítaj viac

Získaj BONUS 8 € v Bitcoinoch

nakup bitcoin z karty

Registrácia Binance

Burza Binance

Aktuálne kurzy