Autor Cointelegraph by Biraajmaan Tamuly

XRP transaction demand falls 91.5% as traders focus on $0.65 support

XRP’s (XRP) onchain activity has contracted sharply since its 2025 peak. The 90-day network fee average fell by 91.5%, while the realized profit-to-loss ratio dropped to 0.38 from 50, according to Glassnode. The decline in activity and profitability comes as traders identify the $1.00-$0.65 region as a major area of interest.  XRP profit-taking flips to network capitulationAccording to Glassnode, the 90-day simple moving average of total fees paid on the XRP network has fallen to just 500 XRP from 5,900 XRP in February, a decline of 91.5%.The network fees are often used as a proxy for transaction demand. The drop points to a sharp slowdown in activity following the speculative surge that carried XRP above $3 in the first half of 2025.XRP total transaction fees. Source: GlassnodeXRP investor behavior has also shifted. Glassnode reported that XRP’s 90-day realized profit-to-loss ratio has fallen to 0.38, meaning market participants are realizing $1 in losses for every $0.38 in profits.In January and July 2025, when the XRP price peaked near $3.40, the ratio reached 50 as profit-taking dominated the onchain flows. That balance has now reversed. This indicates that a larger share of onchain coins are being sold below their acquisition cost, a pattern commonly seen during capitulation phases.XRP realized profit/loss ratio. Source: GlassnodeExchange data offers a different view of holder activity. Crypto analyst Pelin Ay noted that transfers of more than 1 million XRP to Binance have declined since XRP’s 2025 peak. Historically, major corrections were preceded by sharp increases in both the 100,000–1 million XRP and 1 million-plus XRP inflow cohorts as large holders moved tokens to exchanges. The current data shows a sustained decline in exchange-bound XRP from large holders, with inflows from the 100,000–1 million XRP and 1 million-plus XRP cohorts decreasing by 15% and 20%, respectively, since October 2025. The analyst said the latest price weakness appears more closely tied to leverage-driven liquidations and risk-off sentiment than aggressive distribution by large holders.XRP exchange inflows value bands on Binance. Source: CryptoQuantRelated: Arthur Hayes dumps WLD days after Maelstrom’s AI IPO pitch$0.63 is the key area for accumulationXRP’s weekly chart highlights a cluster of technical levels between $1.00 and $0.65.A large fair value gap spans roughly $0.63 to $1.00, created during XRP’s rapid rally in late 2024. The price has already started moving back toward that zone after losing support near $1.40.XRP/USDT, one-week chart. Source: Cointelegraph/TradingViewThe visible-range volume profile data shows relatively light trading activity below current levels until a high-volume node around $0.50–$0.65. The point of control, which marks the price area with the highest traded volume, sits near $0.52–$0.55.The same region aligns with XRP’s five-year ascending trendline, projected to intersect near $0.60–$0.65 in the coming months.Some traders are already treating the zone as an accumulation range. Trader Crypto Patel identified $1.00 to $0.60 as a preferred buying range, while market analyst Javon Marks maintained his long-term breakout target of $15–$18, representing a 1,100% increase. XRP long-term analysis by Javon Marks. Source: XRelated: ETH crash to $1K looms if key support breaks: Will futures traders step in?

Čítaj viac

Pending Bank of Japan rate decision may impact Bitcoin price: Should traders prepare?

Since 2024, Bitcoin (BTC) has posted four major corrections after interest rate hikes by the Bank of Japan (BOJ), with declines ranging from 18% to 28%. This dynamic places renewed attention on the BOJ’s June 16 policy decision. Data currently point to a variety of pressures on BTC, with BTC whale distribution and exchange inflows possibly carrying more weight than Japanese monetary policy.  BOJ hikes and Bitcoin drawdowns: Will history repeat?The relationship between BOJ policy and Bitcoin has gained attention because each rate increase since Japan ended its negative interest rate policy has been followed by a sizable correction. Following the March 19, 2024, hike, Bitcoin corrected by 18%. The July 31, 2024, increase preceded a 18.5% decline. After the Jan. 24, 2025, hike, Bitcoin fell nearly 25%, while the Dec. 19, 2025, decision was followed by a 28% drawdown. Across the four events, Bitcoin’s average decline was 22.4%. BTC/USD, one-week chart. Source: Cointelegraph/TradingViewThe sell-offs did not occur under identical conditions. The March 2024 correction followed Bitcoin’s breakout to new all-time highs during the spot Bitcoin exchange-traded fund (ETF) cycle. The July 2024 decline followed months of consolidation below peak levels and coincided with the sharp unwind of the yen carry trade, which affected global markets. The January and December 2025 drawdowns followed extended rallies and periods of contraction for both BTC spot and futures 30-day demand. BTC: spot and perpetual futures demand growth contraction. Source: CryptoQuantThe relationship between BOJ policy and Bitcoin is often linked to the yen carry trade. For years, investors borrowed yen at low rates and deployed that capital into higher-yielding assets, including stocks and cryptocurrencies. When the BOJ raises rates, some of those positions can be reduced, weighing on risk assets. The July 2024 hike coincided with one of the largest carry-trade unwinds in recent years and a sharp sell-off across global markets, not only BTC. The influence of that particular condition appears smaller today. The BOJ has already raised rates to 0.75% from -0.1% in March 2024, while Japan’s 10-year government bond yield climbed to 2.68% from 0.63% over the same period. Japan’s 10-year bond yield increase since 2024. Source: TradingEconomicsWith Japan’s borrowing costs already higher than during the negative-rate era, each additional hike represents a smaller policy shift than the BOJ’s initial move away from ultra-loose monetary policy. The June 16 meeting would extend an existing tightening cycle rather than introduce a new one. Likewise, market analyst Cryptic Trades noted that concerns about a renewed yen carry-trade unwind are overblown, arguing that Japan has effectively moved away from its deflationary policy framework in 2024. The analyst added,“The Yen Carry Trade has been dead ever since 2024. It is also a BIG nothing burger for the markets.”Related: Bitcoin price may slide toward $30K as institutions dump 450% of daily BTC supplyBTC whales add to the pressureWhile the BOJ meeting is a macro event that traders may monitor, onchain data points to a more immediate source of pressure.Crypto analyst MorenoDV noted that Binance has recorded rising BTC inflows from wallets holding 100–1,000 BTC and 1,000–10,000 BTC since the sell-off began in early June. As a result, the exchange’s 30-day whale inflow sum has climbed to $6.6 billion. Bitcoin whale to exchange flow. Source: CryptoQuantThe pressure is already visible in realized activity. Short- and long-term whales have collectively locked in more than $2.5 billion in losses during the decline, indicating that some large holders have actively reduced exposure.Short-term whales appear particularly vulnerable. The cohort is carrying roughly $16 billion in unrealized losses after briefly returning to profit for around 10 days in early May. Those positions now sit close to break-even levels, creating a potential source of supply during rebounds. MorenoDV said, “Taken together, these three readings describe the stress profile of a late-stage bear market: capitulating whales, distribution into weakness, and a fragile short-term cohort with its finger on the trigger.”Related: Bitcoin may act as a ‘canary in the coal mine’ as risk-off pressure spreads: Bitwise

Čítaj viac

ETH crash to $1K looms if key support breaks: Will futures traders step in?

The Ether (ETH) futures market saw its open interest (OI) on Gate.io fall by 45% to levels last seen in April 2025. At the same time, nearly 480,000 ETH left Binance, OKX, Gemini and Bitfinex over the past few days, reducing the exchange-held supply. The combined shift highlights a market with less leverage and declining exchange balances, placing greater focus on the $1,500 support zone, which some analysts view as critical to preventing a deeper move toward $1,000. Ether open interest falls across exchangesEther’s futures market has undergone a broad reset during the recent sell-off. Crypto analyst Amr Taha noted that total ETH open interest across exchanges has dropped 25%, to $12.6 billion from $16.6 billion in May, with several major trading platforms now at levels last seen in April 2025.Ether open interest. Source: CryptoQuantGate.io recorded the largest decline. ETH open interest fell to $2.68 billion on June 9 from $4.84 billion on May 7, a drop of about 45%. The figure is now nearly identical to the $2.67 billion level recorded on April 11, 2025.Bybit has followed a similar path. ETH OI currently stands near $805 million, close to the $795 million recorded in early April 2025. The move points to a significant reduction in leveraged positions that accumulated during the latter stages of 2025 and early 2026.ETH open interest on multiple exchanges. Source: CryptoQuantHowever, Binance presents a different picture. ETH open interest remains near $2.76 billion, holding within its recent range. The funding rates have also turned negative on the exchange, with the latest reading near -0.0047, showing short traders are paying a premium to maintain their positions.ETH funding rate on Binance. Source: CryptoQuantThe divergence is notable. Gate.io and Bybit have already seen a major leverage reset. Futures traders on Binance remain active, but the negative funding points to a cautious sentiment. Related: Bitmine boosts Ethereum treasury to 5.54M ETH, nearing 5% supply targetETH supply drop meets key support at $1,500Ether exchange reserves also posted a notable decline in early June. Across Binance, OKX, Gemini and Bitfinex, tracked ETH balances fell by 480,000 ETH over the past few days. ETH multi-exchange reserve. Source: CryptoQuantBinance reserves dropped to 3.65 million ETH on June 9 from 3.87 million ETH on June 4. Bitfinex holdings declined to 2.50 million ETH from 2.67 million ETH at the end of May. OKX recorded the sharpest percentage decline, with reserves falling from 424,000 ETH to about 336,000 ETH. Gemini balances also slipped to roughly 522,000 ETH.Continued ETH outflows could reduce the amount of readily available supply on exchanges if buying demand starts to recover. Onchain data shows many ETH holders are still far from large profits. According to market commentator Gonza Goth, only 11% of Ethereum’s supply is currently sitting at a 3x or greater gain, the lowest level since February 2017. However, Goth said, “Historically, extreme pessimism has created the best opportunities.”ETH: relative supply by profit and loss. Source: GlassnodeMeanwhile, traders are also watching the $1,500 level next. Investor Ash Crypto noted that Ether failed to hold every support level during the 2022 bear market, when the price eventually bottomed near $880. The analyst said a weekly close above $1,500 would keep ETH above a historically important support zone, while a break below it would shift attention toward the next major support area near $1,000.ETH/USD, one-week chart analysis by Ash. Source: XRelated: ETH falls to 13-month low on Zcash bug, Bitcoin below $60K: Is $1.4K next?

Čítaj viac

Bitcoin may act as a ‘canary in the coal mine’ as risk-off pressure spreads: Bitwise

Bitcoin’s (BTC) recent performance may be less about crypto market weakness and more about its position at the front of the risk curve. Asset management firm Bitwise said that BTC often acts as a “canary in the macro coal mine,” responding to shifts in liquidity and financial conditions before traditional markets. With equities now showing similar signs of strain, the firm sees Bitcoin’s move as part of a wider risk-off adjustment. Global liquidity and interest rates stay in focus: BitwiseBitwise said that Bitcoin and Ether reached cycle lows of $58,000 and $1,507, respectively, as other global risk assets faced mounting pressure. The Nasdaq recorded its sharpest daily decline of 5% in months, and South Korea’s KOSPI (Korea Composite Stock Price Index), its benchmark stock index, triggered a temporary trading halt after a steep sell-off led by semiconductor stocks.The shift followed stronger-than-expected US labor market data, which reduced expectations for near-term Federal Reserve easing. Higher-for-longer interest rate expectations kept the 10-year US Treasury yields higher and weighed on growth-sensitive assets. The US 10-year yield held near 4.53% on Tuesday after touching 4.68% last month, its highest level in a year.Bitwise pointed to a recurring pattern in which Bitcoin weakens months before equities. Unlike traditional markets, BTC trades continuously and reacts quickly to changes in liquidity conditions.BTC price, NASDAQ, and Global M2 liquidity. Source: Cointelegraph/TradingViewA chart comparing Bitcoin, the Nasdaq, and Global M2 liquidity highlights the divergence. Global M2 has climbed to roughly $122.6 trillion, up steadily over the past year, while Bitcoin has retraced sharply from its $126,000 highs.If Bitcoin is acting as a macro canary, its correction may be telling a different story than a simple risk-off move. BTC has already undergone a significant repricing while global liquidity continues to expand. That leaves open the possibility that Bitcoin is further along in the adjustment process than equities, particularly if liquidity conditions improve later in the cycle. Related: Bitcoin price slips toward $62K local lows as bear-market history keeps repeatingStablecoin reserves signal dry powderOnchain data is offering a different perspective on crypto market liquidity. Independent market analyst Maartunn highlighted that the Stablecoin Supply Ratio (SSR) relative strength index (RSI) has dropped to an oversold reading of 13.Stablecoin supply ratio (SSR) RSI. Source: CryptoQuantThe SSR measures Bitcoin’s market capitalization relative to the market value of major stablecoins such as Tether’s USDt (USDT) and Circle’s USD Coin (USDC). Lower readings indicate larger stablecoin balances relative to Bitcoin’s valuation, pointing to a substantial buying power sitting on the sidelines.Historically, similar SSR RSI readings have appeared near accumulation zones and were followed by periods of stronger price performance once liquidity returned to the market.All stablecoins exchange reserves. Source: CryptoQuantExchange reserve data also points to a sizeable liquidity pool. Combined reserves of major stablecoins on exchanges currently stand near $72 billion, led by $57.7 billion in USDT (USDT) and $12 billion in USDC. The total has eased from late-2025 peaks above $80 billion, though balances remain elevated by historical standards. That leaves a significant amount of capital positioned on exchanges as Bitcoin trades near the lower end of its recent range at $62,000.Related: Bitcoin bottom? These four charts hint at BTC price dropping to $50K

Čítaj viac

Bitcoin rebound highlights discount but $162M bid liquidity points to downside risk

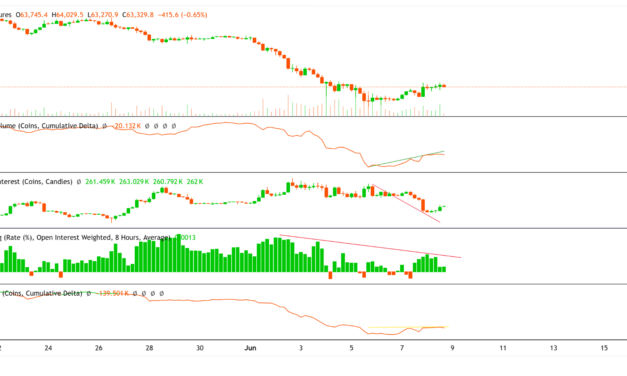
Bitcoin (BTC) rallied toward $64,000 on Monday, but futures market activity was lagging, which may be a sign that the rebound could lose momentum. Traders placed nearly $162 million in buy orders between $57,000 and $59,000, forming one of the largest visible liquidity clusters below the current pricing, potentially setting the stage for BTC’s next move. Bitcoin rebound follows a leverage resetBitcoin’s recovery coincided with a decline in futures market activity. Futures data shows that the aggregated open interest fell to 255,000 BTC from 282,000 BTC during the selloff and even though Bitcoin has recovered from its drop to $59,000, the open interest remains well below last week’s peak.BTC price, spot and futures CVD and funding rate. Source: Velo chartThe funding rate has also turned slightly positive at 0.0013 after briefly dipping below zero. The move shows futures traders are leaning long, but leverage remains relatively muted compared with levels seen before the decline.Spot market activity is also a minor sign of stabilization. The aggregated spot cumulative volume delta (CVD), which tracks the balance between aggressive buyers and sellers, has improved by 11,000 BTC since last Friday. The shift points to a slowdown in aggressive selling after several weeks of persistent distribution.Crypto trader Max Trades reached a similar conclusion, noting that open interest cooled noticeably during the bounce while funding flipped slightly positive. According to the analyst, the move appears to be driven in part by short positions being closed rather than aggressive new longs entering the market.Likewise, Alphractal CEO Joao Wedson said Bitcoin has exited an “extreme leverage” phase and moved into moderate leverage territory following last week’s liquidations. Wedson added that the market has not yet reached historical levels associated with extreme deleveraging, a zone that has often offered stronger accumulation opportunities.Bitcoin: leverage pressure zone. Source: CryptoQuantRelated: Bitcoin price $60K support not yet safe as more macro headwinds stack upBTC liquidity clusters below $60,000Data shows that the dip buyers have placed approximately 2,565 BTC in bid liquidity between $57,000 and $59,000. At current prices near $63,300, those buy orders are worth $162 million.Bid liquidity refers to limit buy orders waiting below the market price. If Bitcoin trades into those levels, the orders may absorb selling pressure and support a rebound if demand outweighs available supply.BTC bid liquidity below $60,000. Source: Velo ChartMarket analyst exitpump highlighted a similar concentration on Binance’s spot order book, noting that the thick liquidity below $60,000 may lead to consolidation and further open interest resets.Meanwhile, trader LP NXT pointed to a six-week pattern in which Monday pivot highs and lows have consistently been followed by the opposite pivot on Wednesday. A Monday high has typically preceded a midweek low and relief rally, while a Monday low has often led to a Wednesday high and renewed price weakness. The streak currently stands at six-for-six, placing additional focus on this week’s midweek price action as Bitcoin trades between the support liquidity below $60,000 and resistance near $64,000.BTC trend analysis by LP. Source: XRelated: ‘Best thesis’ for Bitcoin accumulation surfaces despite current downside risk: Analyst

Čítaj viac

Získaj BONUS 8 € v Bitcoinoch

nakup bitcoin z karty

Registrácia Binance

Burza Binance

Aktuálne kurzy