Bitcoin faces fresh capitulation risk as 50K BTC moved at a loss
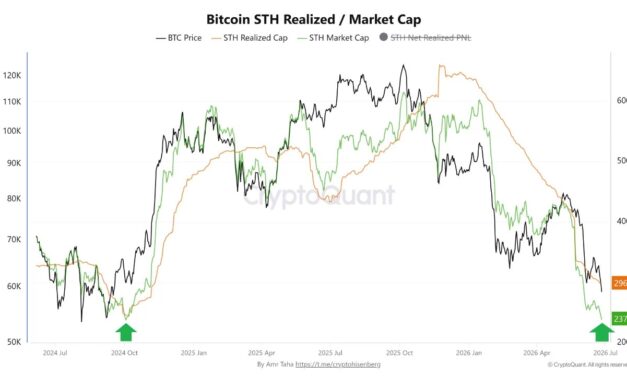
Bitcoin (BTC) is showing fresh signs of short-term holder capitulation after roughly 50,000 BTC moved to exchanges at a loss over the past day. At the same time, the market capitalization of short-term holders fell to $237.7 billion, its lowest level since October 2024. The rise in loss-driven selling comes as tighter monetary conditions and weakening institutional demand continue to weigh on Bitcoin, as analysts underlined a “deeply unfavorable” environment for BTC. Short-term Bitcoin holders show renewed stressCryptoQuant analyst Amr Taha said Bitcoin’s short-term holder (STH) market capitalization fell to $237.7 billion on June 26, its lowest level since Oct. 2, 2024, when it stood near $239.7 billion.BTC STH realized market cap. Source: CryptoQuantThe metric tracks the market value of coins held by investors who bought Bitcoin within the past 155 days. The latest reading shows the cohort’s market value is below its realized value, indicating many recent buyers are holding more unrealized losses.A similar decline appeared during the October 2024 correction, which later aligned with an important Bitcoin bottom. The latest reading serves as a measure of stress rather than confirmation of a market low.Exchange activity adds another layer to the picture. Around 50,000 BTC from short-term holders moved to exchanges at a loss during the past 24 hours, marking the largest loss-to-exchange flow since June 4. Binance alone received roughly 9,500 BTC under similar conditions, its highest reading since June 3.This indicates that near-term sell-side pressure has increased as newer investors react to lower prices.BTC short-term holder profit/loss to exchanges in 24-hours. Source: CryptoQuantHowever, long-term holders’ activity provided a positive development. Bitcoin inflows into accumulation addresses climbed to a record 181,000 BTC on Thursday, almost doubling the previous high of 94,700 BTC recorded in February 2022. These wallets typically receive coins with little spending history, suggesting the surge signals that long-term investors are absorbing supply while short-term holders exit positions.BTC inflows to accumulation addresses. Source: CryptoQuantRelated: Bitcoin may fall lower but BTC power-law frames crash to $58K as ‘normal’Macro headwinds weigh on BTC buyersMarket analyst Darkfost said institutional demand has continued to weaken, with the Coinbase Premium Index staying below zero for 40 consecutive days since May 15.Bitcoin Coinbase premium index. Source: CryptQuantThe indicator compares Bitcoin prices on Coinbase Advanced and Binance. A persistent discount on Coinbase points to heavier selling from professional investors than from retail traders.US macro data also added to the cautious tone. Headline PCE inflation came in at 4.1% against expectations of 4.0%, while Core PCE printed 3.4% versus the 3.3% forecast. GDP also exceeded estimates at 2.1%, keeping expectations for easier monetary policy subdued. Commenting on the current outlook, the analyst said, “This dynamic is a perfect reflection of the current macro backdrop, which remains deeply unfavorable for risk assets such as BTC.”Asset management firm Bitwise said that last week’s Federal Reserve meeting accelerated the hawkish shift after policymakers removed their easing bias and raised the median 2026 Fed funds projection to 3.8% from 3.4% in March. The firm added that tighter financial conditions coincided with continued outflows from crypto exchange-traded products such as the spot ETFs. The attention has also shifted toward Strategy, which has accumulated 174,300 BTC in 2026. Bitwise estimates that roughly 96,000 BTC, or 55% of those purchases, were financed through STRC preferred equity issuances, with another 77,500 BTC funded through MSTR common stock offerings.Now, CryptoQuant noted that STRC traded at a record 17.5% discount to its $100 par value after falling to $82.5 last week, before slipping to around $73 in premarket trading on Friday. Strategy’s cash reserve has dropped 38% since the start of 2026, following the repurchase of a $1.5 billion convertible note. Strategy: Cash reserve and dividend coverage data. Source: CryptoQuantAnnual dividend obligations linked to STRC have also increased to $1.2 billion from $300 million, while dividend coverage has reduced to 14 months, down from as long as seven years. The figures point to tighter funding conditions for one of Bitcoin’s largest institutional buyers, adding another layer of pressure amid rising loss-driven exchange inflows.Related: Bitcoin ETFs post June’s biggest daily outflows as BTC falls below $60K
Čítaj viac