Autor Cointelegraph By Big Smokey

FTX is done — What’s next for Bitcoin, altcoins and crypto in general?

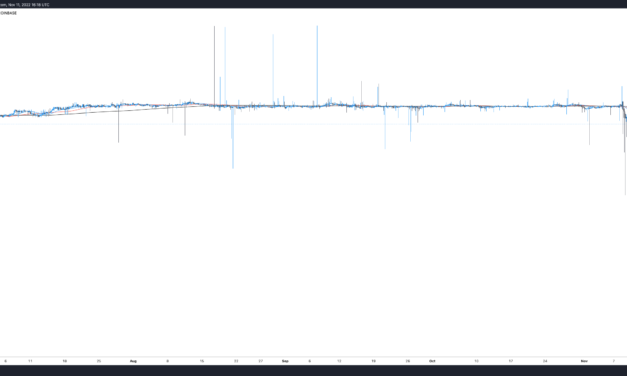
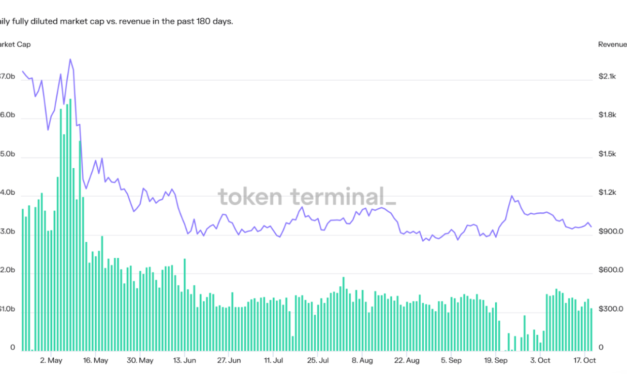
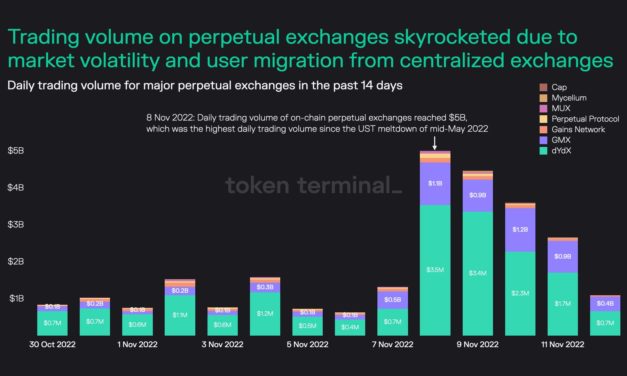
2022 was a tough year for crypto, and November was especially hard on investors and traders alike. While it was incredibly painful for many, FTX’s blowup and the ensuing contagion that threatens to pull other centralized crypto exchanges down with it could be positive over the long run. Allow me to explain. What people learned, albeit in the hardest way possible, is that exchanges were running fractional reserve-like banks to fund their own speculative, leveraged investments in exchange for providing users with a “guaranteed” yield. Somewhere across the crypto Twitterverse, the phrase “If you don’t know where the yield comes from, you are the yield!” is floating around. This was true for decentralized finance (DeFi), and it’s proven true for centralized crypto exchanges and platforms, too. Who would have known that a few ill-timed bank runs would pull down the entire house of cards by proving that while exchanges appear to have high revenue and tons of tokens on their books, many are completely unable to meet user withdrawal requests? They took your coins and collateralized them to fund highly speculative bets. They locked your coins in centralized DeFi platforms to earn yield, some of which they promised to share with you. They placed user funds, along with their own reserves, into illiquid assets that were hard to convert into stablecoins, Bitcoin (BTC) and Ether (ETH) when clients and platform users wanted to access their funds. Not your keys, not your coins. Never has the phrase rang truer. Let’s explore a few things that are happening in the crypto market this week. Investors withdrew a record number of coins from exchanges to self-custodyAs Cointelegraph reported earlier this week, crypto investors panic-withdrew record amounts of Bitcoin, Ether and stablecoins from exchanges. Separate reporting cited a sharp uptick in hardware wallet sales as investors realized the importance of self-custodying their portfolios. If the number of insolvencies and “temporarily pausing of deposits and withdrawals” messages continue to pop up over the next few weeks, it seems likely that this trend of coins leaving exchanges and popping into hardware wallets will continue.With #Bitcoin simply flooding out of exchanges, we now have a ~5yr high in Sovereign Supply of 87.7% of the total.All $BTC which flowed into exchanges since Jan 2018, has now been withdrawn.Self-custody, and spot driven #Bitcoin markets are back on the menu. pic.twitter.com/Kqr36SBBJC— _Checkɱate ⚡☢️️ (@_Checkmatey_) November 18, 2022DEXs and DeFi saw an uptick in inflows, perhaps a sign of things to comeCointelegraph also reported on the uptick in decentralized exchange (DEX) activity and inflow to DeFi occurring concurrently with the record outflows from exchanges. After the events of the past two weeks, trust in centralized exchanges and crypto companies could be broken, and the current and next wave of crypto investors could embrace the more Web3-focused DEX and DeFi protocols. Perpetual exchange volume. Source: Token TerminalOf course, what DeFi and DEXs need are a more transparent framework and processes that ensure user funds are safe and being used “properly.” Related: DeFi platforms see profits amid FTX collapse and CEX exodusA steady flow of bad news could present a nice opportunityCurrently, Ether’s price looks a bit soft from a technical analysis standpoint, and the recent news about the FTX thief holding the 31st largest Ether spot position, plus concerns over censorship, centralization, the United States Office of Foreign Assets Control enforcement on this “whale” and other Ethereum-based protocols that have exposure or bankruptcy proximity to FTX and Alameda could stir up a bit of FUD that impacts the altcoin’s price action.Top 10 addresses with the largest ETH holdings:- 6 are CEX related wallets- Jump Trading coming in third with just over 2M ETH- @arbitrum bridge with ~750K ETH- ETH Staking & WETH contract has over 19M ETH combinedHoping to see less CEXes on the list in a year pic.twitter.com/S1HHi5swnN— Martin Lee | Nansen (@themlpx) November 18, 2022

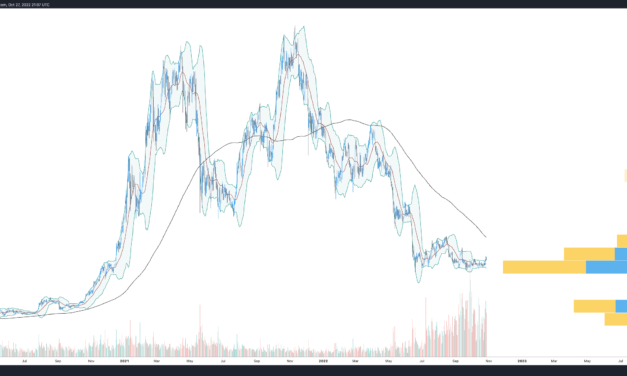
Uncertainty on when the Shanghai upgrade will be enacted and investor concerns about when staked coins can actually be withdrawn are also interesting conversations that could turn short-term sentiment against Ether. ETH/USDT 2-day chart. Source: TradingViewThe thesis is pretty simple. ETH has held support around $1,200–$1,300 pretty well through all of the previous months of bearish market developments, but will the potential challenges mentioned above lead to a test of the level again? Stakers are essentially spotted long and earning yield, so at this juncture, opening a low-level short position with taking profits orders at $700–$600 could possibly be rewarding. This newsletter was written by Big Smokey, the author of “The Humble Pontificator Substack” and resident newsletter author at Cointelegraph. Each Friday, Big Smokey will write market insights, trending how-tos, analyses and early-bird research on potential emerging trends within the crypto market.The views and opinions expressed here are solely those of the author and do not necessarily reflect the views of Cointelegraph.com. Every investment and trading move involves risk, you should conduct your own research when making a decision.

Čítaj viac

3 key crypto price events to watch in the wake of the FTX and Alameda debacle

Up until the start of this week, Bitcoin (BTC) had been demonstrating record-low volatility, and this gave altcoins enough latitude to paint some nice technical setups. At the same time, on-chain data and technical analysis were beginning to suggest that BTC was midway through carving out a bottom, and many analysts believed that brighter days lay ahead. Fast forward to the present, and the volatility spike the market received actually turned out to be a black swan event. As you already know, FTX is kaput. Alameda Research is kaput. BlockFi has put a stop to withdrawals, citing an inability to “operate as usual,” so it’s “pausing client withdrawals as allowed under our Terms,” suggesting that the company is also kaput.The contagion is spreading, and the shrapnel from this Krakatoa-level event is bound to ripple throughout the entire crypto ecosystem. At this time, it’s difficult to make a confident short-term investment thesis for assets by simply looking at the chart, and the best thing unsure investors can do is either stick to a time-tested plan or do nothing. The most likely short-term outcome is volatility will remain high, and crypto prices will continue to whipsaw for a while.Nobody is comfortable focusing on the potential negative outcomes that lie ahead for the crypto sector and cryptocurrency prices, but it’s every investor’s responsibility to consider the absolute worst outcomes and have a contingency plan in place. That way you don’t freak out when shit really hits the fan. Here are a few things to keep an eye on over the coming days. USDT/USD vs. USDC/USD During high volatility events, stablecoins sometimes break their peg with the dollar. If there’s some wild FUD about Bitcoin being banned, hacked or dying, stablecoins prices sometimes rise above $1.00 as traders seek shelter in assets fixed to the dollar. During crypto black swan events, sometimes Tether (USDT) loses its dollar peg. It’s happened a number of times in the past, and usually, once the smoke clears it regains the 1:1 peg. On Nov. 9, USDT/USD broke below its dollar peg, dipping as low as $0.97 at one point, according to data from TradingView and Coinbase. While USDT dipped below its peg, USD Coin’s (USDC) value spiked to $1.01. USDT/USD peg. Source: TradingViewWhile we won’t explore the unconfirmed reasons why there was dislocation between the two, the unsubstantiated rumors related to Tether and Alameda Research can easily be found on Twitter. What’s important to note here is that panic can easily be triggered by false information, rumors and lies, so it doesn’t matter if the rumors about Alameda/Tether are completely false. If it spreads on social media and spooks investors, they’re going to act and in this case; many will or are in the process of flipping their USDT to USDC, BTC or other stablecoins. Similar behavior was seen during the Terra and Celsius implosion. On May 12, USDC’s price spiked from $1.00 to $1.06–$1.19, according to data from TradingView and KuCoin. On the same day, USDT’s value briefly dropped to $0.98 and $0.94. USDC/USD peg. Source: TradingViewWhen the price is dislocated and there are spreads across exchanges, making stablecoin conversions becomes costly and the experience of swapping from one to the other or from an altcoin to stablecoin can become unpleasant. The USDT and USDC dollar peg is something worth keeping an eye on. Bitcoin price expectationsThe Nov. 8 sell-off finally pushed BTC’s price out of the 146-day range where the price fluctuated between $24,500 and $18,600. BTC/USDT 1-day chart. Source: TradingViewThis is a significant range break, and from the viewpoint of technical analysis, failure to recapture this range and increased selling could see the price slice through the volume profile gap to find support in the $11,000–$12,000 range. Unpleasant, yes, but that’s just the current reality. If Bitcoin is able to reclaim and hold the $18,000 handle, at least the price will back in its previous range, and that would be a good sign. A glance at the Ether (ETH) chart reflects a similar set-up where ETH dropped out of a 148-day range between $2,000 and $1,250, but the price has already reclaimed the previous range. ETH/USDT 1-day chart. Source: TradingViewBearish traders have a downside target in the $700 range, but it’s interesting to see how the price has rebounded to trade back around $1,250. Related: Genesis Trading reveals $175M of funds are locked in FTXThe market is searching for firmer footingA lot of crypto-focused companies and investment groups have exposure to FTX and Alameda research, which also means these same companies now have some holes in their own balance sheets. Companies with exposure to #FTX-Sequoia Capital – $213.5 million exposure -Galaxy Digital – $77 million exposure -Crypto.com – Less than $10 million -Amber Group – 10% funds -Kraken – exposure to 9000 FTT -Multicoin Capital – 10% funds-Selini Capital – 3% of their funds— Being Satoshi (@BeingSatoshi) November 10, 2022A handful of these crypto-native companies also hold significant-sized bags of assorted altcoins and decentralized finance (DeFi) tokens. To salvage the current losses, make good on their own loans, and meet their client obligations, it’s possible that a number of these BTC, altcoin and DeFi token stashes could find their way to being market sold on spot exchanges. Altcoins are already down badly, and some are relatively illiquid, meaning a sharp increase in selling could put strong downward pressure on price. Before buying what looks like once-in-a-life-time dips and cycle bottoms, investors should dig around and take a closer look at who are some of the majority holders of the token/project and remember that FTX’s multi-billion-dollar implosion is yet to be fully felt throughout the sector. Now is the time to research and do due diligence before making any investment in any cryptocurrency. This newsletter was written by Big Smokey, the author of The Humble Pontificator Substack and resident newsletter author at Cointelegraph. Each Friday, Big Smokey will write market insights, trending how-tos, analyses and early-bird research on potential emerging trends within the crypto market.The views and opinions expressed here are solely those of the author and do not necessarily reflect the views of Cointelegraph.com. Every investment and trading move involves risk, you should conduct your own research when making a decision.

Čítaj viac

Is Bitcoin bullish or nah? Here is what is really going on with BTC price

Since March 2022, traders and so-called analysts have been forecasting a policy change or pivot from the United States Federal Reserve. Apparently, such a move would prove that the Fed’s only available option is to print into oblivion, further diminishing the value of the dollar and enshrining Bitcoin (BTC) as the world’s future reserve asset and ultimate store of value. Apparently. Well, this week (Nov. 2) theFed raised interest rates by the expected 0.75%, and equities and crypto rallied like they usually do.But this time, there was a twist. Prior to the FOMC gathering, there were a few unconfirmed leaks that the Fed and White House were considering a “policy pivot.” According to comments issued by the FOMC and during Jerome Powell’s presser, Powell emphasized that the Fed is aware of and monitoring how policy is impacting markets and that the latency of interest rate hikes is being acknowledged and considered. According to the Fed: “In order to attain a stance of monetary policy that is sufficiently restrictive to return inflation to 2 percent over time. In determining the pace of future increases in the target range, the Committee will take into account the cumulative tightening of monetary policy, the lags with which monetary policy affects economic activity and inflation, and economic and financial developments.”Sounds a bit pivot-y, no? The crypto market seemed to think not, and shortly after Powell gave his live comments, Bitcoin, altcoins and equities retracted their brief single-digit gains. The shock here is not that Bitcoin’s price pulled back prior to the FOMC, rallied after the estimated hike was announced and then retracted before the stock market closed. This is to be expected, and I wouldn’t be surprised if BTC returns to the lower end of $21,000 since $20,000 appears to be solidified as support. What is surprising is there was a dash of pivot language, and markets didn’t react accordingly. Let that be a lesson on buying into narratives too deeply. In my opinion, trading the FOMC, CPI and rate hikes is not the way to go. Sure, if you’re a day trader, have deep pockets to benefit from those 2% or 4% moves or are an experienced, skilled professional trader, then go for it. But, as shown in the chart from Jarvis Labs, trading FOMC and CPI really can just chop traders up. BTC price action before and after FOMC events. Source: Jarvis LabsI’m of the mind that intraday price moves from Bitcoin on a less-than-daily time frame are irrelevant if your motive is to be long on Bitcoin and increase the stack. So, instead of focusing on micro events like how the Fed continues to raise rates, a policy it is resolute on until inflation drops to its 2% target, let’s look at other metrics that assess Bitcoin’s current market structure and projected performance. Related: Why is Bitcoin price up today?On-chain data suggests it’s time to accumulateBitcoin Yardstick metric. Source: Glassnode and Capriole InvestmentsOn Nov. 1, Capriole Investments founder Charles Edwards debuted a new on-chain metric called the Bitcoin Yardstick. According to Edwards, the metric takes “Bitcoin market-cap / hash rate, and normalized (divided by) the 2 year average” to essentially take “the ratio of energy work done to secure the Bitcoin network in relation to price.” Edwards explains that “lower readings = cheaper Bitcoin = better value,” and in his opinion: “Today we are seeing valuations unheard of since Bitcoin was $4 – $6K.”Similar to Glassnode’s recent report, Edwards also believes that long-term holders have already capitulated. After citing the chart below, Edwards said: “Net unrealized profit and loss (NUPL) is showing a washout in long-term holders. We have entered the capitulation zone (red) seen only once every 4 years in the past.”As discussed in last week’s Bitcoin on-chain update, multiple on-chain metrics are at multi-year lows, and there is sufficient precedent to suggest upside gains far outweigh the downside potential at the moment. Did Bitcoin’s MACD histogram turn bullish? Another metric causing a buzz in trader circles is the moving average convergence divergence (MACD). Throughout the week, multiple traders cited the indicator, noting that a convergence between the signal line and MACD and the histogram turning “green” on the weekly timeframe as encouraging signs that Bitcoin is in a bottoming process. BTC 1-week MACD. Source: TradingViewWhile the indicator is not meant to be interpreted as a pure signal in isolation, crossovers on the weekly and monthly time frame, along with the histogram flipping from red to green, have usually been accompanied by a steady uptick in bullish momentum. While data is unable to confirm whether a market bottom is truly in, comparing the current readings to previous market cycles and Bitcoin’s price action does suggest that BTC is undervalued in its current range. BTC’s price may be carving out a bottom, but this does not rule out the possibility of the occasional crypto- and equities market-related sell-off that could catalyze a swift wick down to the yearly low. This newsletter was written by Big Smokey, the author of The Humble Pontificator Substack and resident newsletter author at Cointelegraph. Each Friday, Big Smokey will write market insights, trending how-tos, analyses and early-bird research on potential emerging trends within the crypto market.The views and opinions expressed here are solely those of the author and do not necessarily reflect the views of Cointelegraph.com. Every investment and trading move involves risk, you should conduct your own research when making a decision.

Čítaj viac

Bitcoin price broke out this week, but has the trend changed?

Welcome readers, and thanks for subscribing! The Altcoin Roundup newsletter is now authored by Cointelegraph’s resident newsletter writer Big Smokey. In the next few weeks, this newsletter will be renamed Crypto Market Musings, a weekly newsletter that provides ahead-of-the-curve analysis and tracks emerging trends in the crypto market. The publication date of the newsletter will remain the same, and the content will still place a heavy emphasis on the technical and fundamental analysis of cryptocurrencies from a more macro perspective in order to identify key shifts in investor sentiment and market structure. We hope you enjoy it! Time to go long? This week, Bitcoin’s (BTC) price has perked up, with a surge to $21,000 on Oct. 26. This led a handful of traders to proclaim that the bottom might be in or that BTC is entering the next phase of some technical structure like Wyckoff, a range break or some sort of support resistance flip. Prior to getting all bullish and opening 10x longs, let’s dial back to a previous analysis to see if anything in Bitcoin’s market structure has changed and whether the recent spat of bullish momentum is indicative of a wider trend change. When the last update was published on Sept. 30, Bitcoin was around $19,600, which is still within the bounds of the last 136 days of price action. At the time, I had identified bullish divergences on the weekly relative strength index (RSI) and moving average confluence divergence (MACD). There were also a handful of potential “bottoming” signals coming from multiple on-chain indicators, which were at multi-year lows. Let’s take a look at how things are looking now. The Bollinger Bands are tightThe Bollinger Bands on the daily time frame remains constricted, and this week’s surge to $21,000 was the expansion or spike in volatility that most traders have been expecting. As is par for the course, after breaking out from the upper arm, the price has retraced to test the mid-line/mid-band (20MA) as support. Despite the strength of the move, the price remains capped below the 200-MA (black line), and it is unclear at this moment if the 20-MA will now serve as support for Bitcoin’s price.BTC/USD daily chart with Bollinger Bands. Source: TradingViewAfter bouncing off a near-all-time low at 25.7, the weekly RSI continues to trend upward and the bullish divergence identified in the previous analysis remains in play. A similar trend is also being held by BTC’s weekly MACD. In the same chart, we can see that the most recent weekly candle is en route to creating a weekly higher high. If the candle closes above the range high of the previous five weeks and the price sees continuation over the coming weeks with a daily or weekly close above $22,800, this could be the makings of a trend reversal. BTC/USD weekly chart. Source: TradingViewOn the daily timeframe, BTC’s Guppy multiple moving averages (GMMA or Super Guppy) indicator is eyebrow-raising. There is compression of the short-term moving averages, and they are converging with the long-term moving averages, which typically indicates an impending directional move or, in some instances, a macro trend reversal in the making. BTC/USD daily chart. Source: TradingViewFor the past few weeks, Bitcoin’s “record-low volatility” has been the talk of the town and when using the Bollinger Bands, the GMMA and BVOL, the tightening price range does hint at expansion, but to what direction remains a mystery. Bitcoin has been trading in the $18,600–$24,500 range for 36 days and from the perspective of technical analysis, the price remains near the middle of that range. The move to $21,000 did not set a significant daily higher high nor escape from the current range, which essentially is a sideways chop. The price is holding above the 20-day moving average for now, but we have yet to see the 20-MA cross above the 50-MA, and the majority of the Oct. 26 rally has retraced back to the low $20,000 level. BTC/USD daily chart. Source: TradingViewA more convincing development would involve Bitcoin breaking out of the current range block to test the 200-MA at $24,800 and eventually making some attempt to flip the moving average to support. A further extension to the $29,000–$35,000 range would inspire confidence from bulls looking for a clearer sign of a trend reversal. Until that happens, the current price action is simply more consolidation that is pinned by resistance extending all the way to $24,800. Related: Why is the crypto market up today? Bitcoin on-chain data says to accumulateLike BTC’s spot price, the MVRV Z-Score has also bounced around in the -0.194 to -0.023 zone for the past three months. The on-chain metric reflects a ratio of BTC’s market capitalization against its realized capitalization (the amount people paid for BTC compared to its value today). Bitcoin 3-month MVRV Z-Score. Source: GlassnodeIn short, if Bitcoin’s market value is measurably higher than its realized value, the metric enters the red area, indicating a possible market top. When the metric enters the green zone, it signals that Bitcoin’s current value is below its realized price and that the market could be nearing a bottom.Bitcoin MVRV Z-Score. Source: GlassnodeAccording to the MVRV Z-Score chart, when compared against Bitcoin’s price, the current -0.06 MVRV Z-Score is in the same range as previous multiyear lows and cycle bottoms.Reserve RiskBitcoin’s Reserve Risk metric displays how “confident” investors are contrasted against the market price of BTC.When investor confidence is high, but BTC’s price is low, the risk-to-reward or Bitcoin attractiveness versus the risk of buying and holding BTC enters the green area.During times when investor confidence is low, but the price is high, Reserve Risk moves into the red area. Historical data suggests that building a Bitcoin position when Reserve Risk enters the green zone has been a good time to establish a position.Bitcoin 6-month Reserve Risk. Source: GlassnodeCurrently, we can see that over the past six months, the metric has been carving out what investors might describe as a bottom. At the time of writing, reserve risk is rising toward 0.0009, and typically, crossing the 0.001 threshold into the green zone has marked the start of a recovery.Bitcoin Reserve Risk. Source: GlassnodeLooking forwardMultiple data points appear to suggest that Bitcoin’s price is undervalued and still in the process of carving out a bottom, but none confirms that the actual market bottom is in. This week, and in previous months, multiple Bitcoin mining businesses have publicly announced the need to restructure debt, the possibility of missed debt payments, and some have even hinted at potential bankruptcy. Most publicly listed miners have been selling the majority of their mined BTC since June, and the recent headlines concerning Compute North and Core Scientific hint that Bitcoin’s price is still at risk due to solvency issues among industrial miners. Data from Glassnode shows the aggregate size of miner balances hovering around 78,400 BTC being “held by miners we have labelled (accounting for 96% of current hashrate).”According to Glassnode, in the event of “income stress,” it is possible that miners will be forced to liquidate tranches of these reserves in the open market, and the knock-on effect on Bitcoin’s price could be the next catalyst of a sell-off to new yearly lows. This newsletter was written by Big Smokey, the author of The Humble Pontificator Substack and resident newsletter author at Cointelegraph. Each Friday, Big Smokey will write market insights, trending how-tos, analyses and early-bird research on potential emerging trends within the crypto market.The views and opinions expressed here are solely those of the author and do not necessarily reflect the views of Cointelegraph.com. Every investment and trading move involves risk, you should conduct your own research when making a decision.

Čítaj viac

3 reasons why DeFi investors should always look before leaping

Welcome readers, and thanks for subscribing! The Altcoin Roundup newsletter is now authored by Cointelegraph’s resident newsletter writer Big Smokey. In the next few weeks, this newsletter will be renamed Crypto Market Musings, a weekly newsletter that provides ahead-of-the-curve analysis and tracks emerging trends in the crypto market. The publication date of the newsletter will remain the same, and the content will still place a heavy emphasis on the technical and fundamental analysis of cryptocurrencies from a more macro perspective in order to identify key shifts in investor sentiment and market structure. We hope you enjoy it! DeFi has a problem, pump and dumpsWhen the bull market was in full swing, investing in decentralized finance (DeFi) tokens was like shooting fish in a barrel, but now that inflows to the sector pale in comparison to the market’s heyday, it’s much harder to identify good trades in the space. During the DeFi summer, protocols were able to lure liquidity providers by offering three- to four-digit yields and mechanisms like liquid staking, lending via asset collateralization and token rewards for staking. The big issue was many of these reward offerings were unsustainable, and high emissions from some protocols led liquidity providers to auto-dump their rewards, creating constant sell pressure on a token’s price. Total value locked (TVL) wars were another challenge faced by DeFi protocols, which had to constantly vie for investor capital in order to maintain the number of “users” willing to lock their funds within the protocol. This created a scenario where mercenary capital from whales and other cash-flush investors essentially airdropped funds to platforms offering the highest APY rewards for a short period of time, before eventually dumping rewards in the open market and shifting the investment funds to the greener pastures. For platforms that secured series funding from venture capitalists, the same sort of activity took place. VCs pledge funds in exchange for tokens, and these entities reside in the ranks of the largest tokenholders in the most lucrative liquidity pools. The looming threat of token unlocks from early investors, high reward emissions and the steady auto-dumping of said rewards led to constant sell pressure and obviously stood in the way of any investor deciding to make a long investment based on fundamental analysis. Combined, each of these scenarios created a vicious cycle where protocol TVL and the platform’s native token would basically launch, pump, dump and then slip into obscurity. Rinse, wash, repeat. So, how does one actually look beyond the candlestick chart to see if a DeFi platform is worth “investing” in? Let’s take a look. Is there revenue? Here are two charts. Algorand market capitalization vs. revenue (180 days). Source: Token TerminalGMX market cap vs. revenue (180 days). Source: Token TerminalYes, one is going up and the other is going down (LOL). Of course, that’s the first thing investors look for, but there’s more. In the first chart, one will notice that Algorand (ALGO) has a $2.15-billion circulating market cap and a fully diluted market cap of $3.06 billion. Yet its 30-day revenue and annualized revenue are $7,690 and $93,600, respectively. Eye-raising, isn’t it? Algorand protocol data. Source: Token TerminalCircling back to the first chart, we can see that while maintaining a $2.15-billion circulating market cap and supporting a wide ecosystem of assorted decentralized applications (DApps), Algorand only managed to produce $336 in revenue on Oct. 19. Unless there’s something wrong with the data or some metrics related to Algorand and its ecosystem are not captured by Token Terminal, this is shocking. Looking at the chart legend, one will also note that there are no token incentives or supply-side fees distributed to liquidity providers and token stakers.Related: 3 emerging crypto trends to keep an eye on while Bitcoin price consolidatesGMX, on the other hand, tells a different story. While maintaining a circulating market cap of $272 million and an annualized revenue of $28.92 million, GMX’s cumulative supply-side fees have steadily increased to the tune of $33.9 million since April 24, 2022. Supply-side fees represent the percentage of fees that go to service providers, including liquidity providers. GMX cumulative supply side fees vs. revenue. Source: Token TerminalIssuance and inflation Before investing in a DeFi project, it’s wise to take a look at the token’s total supply, circulating supply, inflation rate and issuance rate. These metrics measure how many tokens are currently circulating in the market and the projected increase (issuance) of tokens in circulation. When it comes to DeFi tokens and altcoins, dilution is something that investors should be worried about, hence the allure of Bitcoin’s (BTC) supply cap and low inflation. Bitcoin issuance and inflation data. Source: MessariAs shown below, compared to BTC, ALGO’s inflation rate and projected total supply are high. ALGO’s total supply is capped at 10 billion, with data showing 7 billion tokens in circulation today, but given the current revenue generated from fees and the amount shared with tokenholders, the supply cap and inflation rate don’t inspire much confidence. Before taking up a position in ALGO, investors should look for more growth and daily active users of Algorand’s DApp ecosystem, and there obviously needs to be an uptick in fees and revenue. ALGO issuance and inflation data. Source: MessariActive addresses and daily active usersWhether revenues are high or low, two other important metrics to check are active addresses and daily active users if the data is available. Algorand has a multi-billion-dollar market cap and a 10-billion ALGO max supply, but low annual revenue and few token incentives present the question of whether the ecosystem’s growth is anemic. Viewing the chart below, we can see that ALGO active addresses are rising, but generally, the growth is flat, and active address spikes appear to follow price surges and sell-offs. As of Oct. 14, there were 72,624 active addresses on Algorand.ALGO active address count. Source: MessariLike most DeFi protocols, the Polygon network has also seen a steady decline in daily active users and MATIC’s price. Data from CryptoQuant shows 2,714 active addresses, which pales in comparison to the 16,821 seen on May 17, 2021. Polygon active address count. Source: CryptoQuantStill, despite the decline, data from DappRadar shows a good deal of user activity and volume spread across various Polygon DApps. Polygon DApps. Source: DappRadarThe same cannot be said for the DApps on Algorand.Algorand DApps. Source: DappRadarRight now, the crypto market is in a bear market, and this complicates trading for most investors. At the moment, investors should probably sit on their hands instead of taking kiss-and-a-prayer moon shots at every small breakout that turns out to be bull traps. Investors might be better served by just sitting on their hands and tracking the data to see when new trends emerge, then looking deeper into the fundamentals that might back the sustainability of the new trend. This newsletter was written by Big Smokey, the author of The Humble Pontificator Substack and resident newsletter author at Cointelegraph. Each Friday, Big Smokey will write market insights, trending how-tos, analyses and early-bird research on potential emerging trends within the crypto market.The views and opinions expressed here are solely those of the author and do not necessarily reflect the views of Cointelegraph.com. Every investment and trading move involves risk, you should conduct your own research when making a decision.

Čítaj viac
  • 1
  • 2

Získaj BONUS 8 € v Bitcoinoch

nakup bitcoin z karty

Registrácia Binance

Burza Binance

Aktuálne kurzy