Autor Cointelegraph By Beau Linighan

Even after the pullback, this crypto trading algo’s $100 bag is now worth $20,673

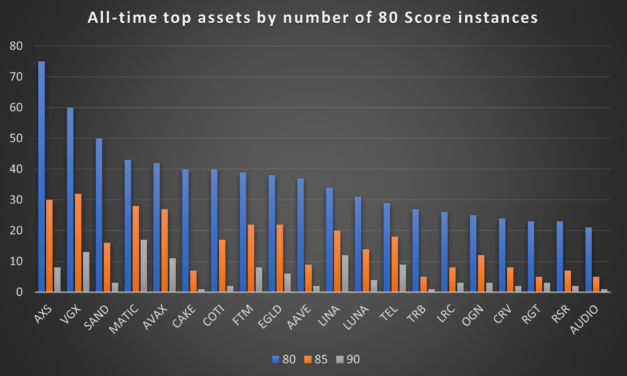
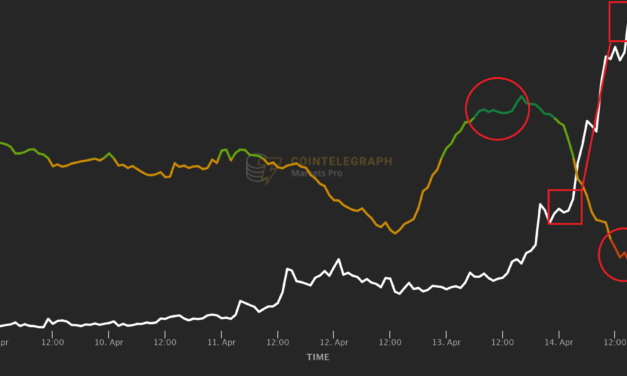
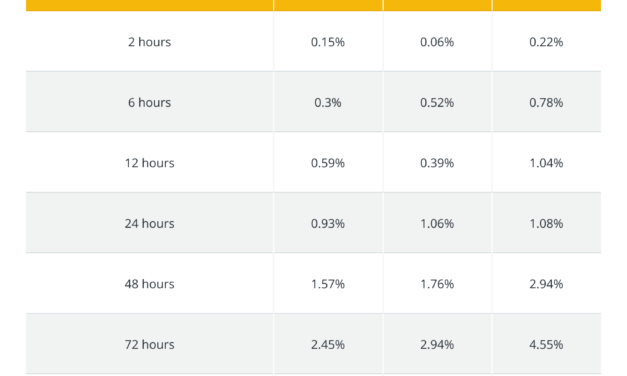
Exactly one year ago, on Jan. 9, 2021, Cointelegraph launched its subscription-based data intelligence service, Markets Pro. On that day, Bitcoin (BTC) was trading at around $40,200, and today’s price of $41,800 marks a year-to-year increase of 4%. An automated testing strategy based on Markets Pro’s key indicator, the VORTECS™ Score, yielded a 20,573% return on investment over the same period. Here is what it means for retail traders like you and me.How can I get my 20,000% a year?The short answer is – you can’t. Nor can any other human. But it doesn’t mean that crypto investors cannot massively enhance their altcoin trading game by using the same principles that underlie this eye-popping ROI.The figure in the headline comes from live testing of various VORTECS™-based trading strategies that kicked off on the day of the platform’s launch. Here is how it works.The VORTECS™ Score is an AI-powered trading indicator whose job is to sift through each digital asset’s past performance and identify multi-dimensional combinations of trading and social sentiment metrics that are historically bullish or bearish. For example, consider a hypothetical situation where each time Solana (SOL) sees an extra 150% of positive tweet mentions combined with a 20% to 30% in trading volume against a flat price, its price spikes massively within the next two to three days.Upon detecting a historically bullish arrangement like this one in, say, SOL’s real-time data, the algorithm will assign the asset a strong VORTECS™ Score. The conventional cutoff for bullishness is 80, and the more confident the model is that the outlook is favorable, the higher the Score.In order to get a sense of how the model performs, starting from day one the Markets Pro team live-tested a number of hypothetical trading strategies based on “buying” all assets that cross a certain VORTECS™ Score and then “selling” them after a fixed amount of time.These transactions were executed in a spreadsheet rather than an exchange (hence no fees to eat off the gains), 24/7, and involved complex algorithmic rebalancing to ensure that at any given moment all assets that hit a reference Score are held in equal shares in the portfolio. In short, following these strategies was something only a computer could do.The winning strategy, “Buy 80, Sell 24 hours” entailed buying every asset that reached the Score of 80 and selling it exactly 24 hours later. This algorithm yielded a hypothetical 20,573% of gains over one year. Even among other humanly impossible strategies, it is an outlier: the second-best one, “Buy 80, Sell 12 hours,” generated 13,137%, and number three, “Buy 80, Sell 48 hours,” yielded a “mere” 5,747%.Down to earthWhat these insane numbers show is that the returns that high- VORTECS™ assets generated compounded nicely over time. But what’s the use if real-life traders could not replicate the compounding strategy? A more practical way to look at the VORTECS™ model’s performance is through average returns after high Scores. No fancy rebalancing, just a plain average price change that all high-scoring tokens demonstrated X hours after reaching the Score of Y. Here are the numbers:These look much more modest, don’t they? However, if you think of it, the picture that these averages paint is no less powerful than the mind-blowing hypothetical annual returns. The table demonstrates robust positive price dynamics after high Scores, averaging across all types of assets and in all market situations that occurred throughout the year.The trend is unmistakable: tokens that hit VORTECS™ Scores of 80, 85, and 90, tend to appreciate within the next 168 hours. Higher Scores are associated with greater gains: the algorithm’s stronger confidence in the bullishness of the observed conditions, indeed, comes with greater yields (although higher Scores are also rarer). Another important factor is time: the longer the wait after a reference threshold is reached, the greater the average ROI.GET MARKETS PRO RIGHT NOWIn this sense, rather than trying to follow the complex “Buy 80, Sell 24 hours” algorithmic strategy (which is, again, a futile exercise), real-life traders could maximize their fortunes by buying at higher Scores and holding for longer times.Varying predictabilityA separate stream of internal Markets Pro research looked at whether some coins are more prone than others to exhibit historically bullish trading conditions before dramatic price increases. This turned out to be the case, with tokens like AXS, MATIC, AAVE and LUNA leading the pack in terms of the most reliable positive price dynamics following historically favorable setups. Overall, the majority of frequent high-VORTECS™ performers delivered robust positive returns.After a full year in operation, these disparate pieces of quantitative evidence – the mind-bending ROIs of algorithmic live-testing strategies, high-VORTECS™ assets’ sound average gains, and individual coins’ steady average returns after high Scores – present a compelling case for the utility of the “history rhymes” approach to crypto trading.Obviously, a favorable historic outlook, captured by a strong VORTECS™ Score, is never a guarantee of an impending rally. Yet, an extra pair of algorithmic eyes capable of seeing through and comparing across billions of historical data points to alert you of digital assets’ bullish setups before they materialize can be an incredibly powerful addition to any trader’s toolkit.Cointelegraph is a publisher of financial information, not an investment adviser. We do not provide personalized or individualized investment advice. Cryptocurrencies are volatile investments and carry significant risk including the risk of permanent and total loss. Past performance is not indicative of future results. Figures and charts are correct at the time of writing or as otherwise specified. Live-tested strategies are not recommendations. Consult your financial advisor before making financial decisions.

Čítaj viac

Here are the most predictable tokens of 2021 – for those who knew where to look

Digital assets’ past performance is never a guarantee of future price movement. There are never two identical situations in the crypto marketplace, so even historically similar patterns of a token’s behavior can be followed by starkly different price action charts.Still, crypto assets’ individual history of price action often rhymes, giving those who can ready this history right a massive edge over other traders. And, importantly, some tokens are much more likely than others to exhibit recurring behavior, which makes their bullish setups more recognizable ahead of time.Cointelegraph Markets Pro, a subscription-based data intelligence platform whose job is to search for regularities in crypto assets’ past trading behavior and alert traders to historically bullish conditions around individual assets, has been live for almost an entire year now. Based on a year’s worth of tokens’ performance data, here are the assets that exhibited historically bullish trading conditions most frequently, along with their subsequent price dynamics.Top 20 digital assets by the number of days with VORTECS™ Scores of 80, 85, and 90. Source: Cointelegraph Markets ProThe chart shows top 20 digital assets by the overall number of instances when they hit a VORTECS™ Score of 80. The VORTECS™ Score is an algorithmic indicator that considers a host of variables around each coin — including market outlook, price movement, social sentiment, and trading activity — to assess whether its present conditions are historically bullish, neutral, or bearish. Conventionally, VORTECS™ Scores above 80 are considered confidently bullish, while 90 and above indicate the model’s extreme confidence in the asset’s tremendously favorable outlook.Despite metaverse coins – AXS and SAND – occupying spots number one and three on this list, no single digital asset sector dominates the chart, with layer-one and DeFi tokens also widely represented in the top 20. It appears from this data that tokens’ likelihood to exhibit historically favorable trading patterns does not depend on asset class.For example, AXS has gone above the Score of 80 on 75 occasions, while layer-one AVAX recorded 42 instances of a historically favorable outlook, and DeFi token COTI sported 40 high-VORTECS™ days.Average gains generated by top 20 high-VORTECS™ assets 24, 48, and 96 hours after reaching the Scores of 80 and 90. Source: Cointelegraph Markets ProThe second chart presents the average gains that frequent top VORTECS™ performers yielded 24, 48, and 96 hours after hitting the Scores of 80 and 90. There are few bars pointing below zero, but the majority show solid positive returns, meaning that most assets consistently appreciated after demonstrating strong bullish conditions. Here’s AVAX, one of the top performers:24 hours after Score 80: Average gain 2.5%48 hours after Score 80: Average gain 5.3%96 hours after Score 80: Average gain 10.4%24 hours after Score 90: Average gain 10.8%48 hours after Score 90: Average gain 16.0%96 hours after Score 90: Average gain 19.1%Other high scorers boast even more impressive returns on certain timeframes. For one, LUNA did exceptionally well 48 and 96 hours after achieving a VORTECS™ Score of 90, yielding on average 31.7% and 40.9%, respectively.GET MARKETS PRO RIGHT NOWGranted, some assets behaved less consistently, with average returns bars pointing both above and below zero, while others, like AAVE, LRC, and OGN tended to lose value after flashing historically bullish patterns.Nevertheless, the performance of most of the featured assets is overwhelmingly positive, beating the market by a wide margin. This trend is observed across hundreds of VORTECS™ Score instances and remains robust over the period of 12 months that included stints of bull, bear, and sideways market. It might not be a universal law, but it is evident that there is a sizable group of well-performing crypto tokens whose history often rhymes, much to the savvy traders’ delight.Cointelegraph is a publisher of financial information, not an investment adviser. We do not provide personalized or individualized investment advice. Cryptocurrencies are volatile investments and carry significant risk including the risk of permanent and total loss. Past performance is not indicative of future results. Figures and charts are correct at the time of writing or as otherwise specified. Live-tested strategies are not recommendations. Consult your financial advisor before making financial decisions.

Čítaj viac

Law Decoded: Three regulatory trends of 2021, Dec. 20–27

It is that time of the year: Singular events must be abandoned in favor of end-of-year, big-picture narratives and yearly lessons learned. As many governments across the globe finally had to face the rapidly mainstreaming realm of digital finance, the year is packed with developments in crypto policy and regulation that are impossible to fit into a neat little summary. However, it is possible to try and distill several major trends that have come to the fore during the past 12 months, and that will keep shaping the relationship among societies, state power and the crypto space as we roll into 2022.Below is the concise version of the latest “Law Decoded” newsletter. For the full breakdown of policy developments over the last week, register for the full newsletter below.U.S. Congress notices cryptoIn 2021, crypto regulation in the United States ceased to be mostly the domain of unelected officials sitting on various financial regulatory commissions and within the Treasury Department. Federal lawmakers called more high-profile Congressional hearings on digital assets than in any previous year. Their command of crypto-related issues has also improved visibly. The executive branch still attempted to steer important decisions — the approach most vividly illustrated by the last-minute inclusion of crypto broker reporting requirements into the infrastructure bill — yet the backers of such course were likely caught off-guard by a vocal, concerted pushback from the industry and its allies on the Capitol Hill. Granted, not everyone in Congress is a Bitcoin buff, but there are still quite a few, and some are making crypto salient on their legislative agendas.The emergence of crypto as a conspicuous matter of public policy in the age of partisan polarization has also raised a question of where each of the two major U.S. political parties stands on digital asset-related issues. The coming year will likely see further crystallization of partisan crypto stances.Authoritarians lean toward the hardlineAnother emerging rift can be observed in how various political systems have come to approach crypto depending on where they stand on the liberal-authoritarian continuum. Obviously, all agents of power strive to maximize the degree of control they exert over payment systems and the financial system more broadly, yet in 2021, those who make greater use of the free-market look more likely to co-opt rather than heavily restrict the digital asset space.The approach exemplified by China and its outlawing of crypto trading and mining mark the heavy-handed end of the policy palette. The alternative is opening up to financial innovation and reaping the benefits of such openness at the cost of limited control.The struggle between these two stances has been intensifying within several big economies that can be reasonably expected to opt for a more hardline scenario. While an imminent threat seems to have been averted in India, inconclusive signals emanating from Russia and Turkey suggest that forces championing the hawkish approach are extremely influential there.Unprecedented rates of legal exposureFrom El Salvador becoming the first crypto nation with a legal tender status for Bitcoin (BTC) to the U.S. Securities and Exchange Commission finally allowing a Bitcoin exchange-traded fund to the market, more people than ever now have a legal way to use cryptocurrency for payments and investment.Still, narrative shifts driven by these historic advancements resonate far beyond the crypto bubble, leading to new waves of mainstream interest. With both the awareness and exposure on the rise, it gets harder for policymakers to ignore the new economic and social reality where Bitcoin and its siblings are present in the lives of millions. At this point, there is no stopping the virtuous cycle of global crypto adoption, and in 2022, there will be even less room for the powers that be to remain oblivious to crypto-driven social transformation.

Čítaj viac

Law Decoded: Making sense of mixed signals, Dec. 13–20

The crypto regulation regime in any jurisdiction is an equilibrium among multiple institutional, group and personal interests of actors who have a sway over financial and monetary policies. These interests never perfectly align, frequently resulting in contradictory signals coming out of various power centers. Speaking about systemic risks facing the world’s largest economy last week, the United States Federal Reserve chair said digital assets were not a financial stability concern. Two days later, the U.S. Financial Stability Oversight Council issued a report that concluded that stablecoins and decentralized finance could pose sizeable financial stability risks. The source of this discrepancy could lie in the fact that the Fed’s mandate is to maintain a robust economy, while the FSOC, which has roots in the Dodd-Frank reform, is explicitly tasked with spotting systemic risks. The shape of the hammer that each regulatory actor wields bears on how they see the digital asset nails, which holds true beyond the U.S. context.Below is the concise version of the latest “Law Decoded” newsletter. For the full breakdown of policy developments over the last week, register for the full newsletter below.From Russia with FUDRecent reports from Russia have stirred crypto investors’ fears that the hard line on digital assets, championed by the nation’s central bank, could be prevailing in the crypto regulation debate that had been simmering for years. The Bank of Russia opened last week with an announcement that mutual funds will be banned from investing in cryptocurrencies and crypto derivatives. Next came a series of the central bank governors’ critical remarks on crypto, furnished with an implication that the idea of a blanket ban was not off the table. Anxious traders sought relief in the statements by the chair of the Financial Markets Committee of the Russian parliament, Anatoly Aksakov. At a press conference, Aksakov noted that the intransigent path was not the only one that the Russian authorities are considering. The alternative is a scenario where exchanges are regulated and mining is taxed.U.S. partisan divideAnother forum where opposing opinions on digital asset-related matters clashed last week was the U.S. Senate Committee on Banking, Housing and Urban Affairs floor. A hearing on “Stablecoins: How do They Work, How Are They Used, and What Are Their Risks?” saw industry experts, academics and think tank analysts offer a range of viewpoints on dollar-pegged cryptos and their role in the financial system. Critics such as Senator Elizabeth Warren have continued telling their cautionary tales of stablecoin risks and dangers of the DeFi space. Meanwhile, allies such as Senator Pat Toomey highlighted aspects of the technology that promote financial inclusion and increased efficiency.Updates from U.S. watchdogsInterestingly, conflicting signals emanated even from the U.S. Securities and Exchange Commission last week. Commissioner Hester Peirce, widely known as Crypto Mom, publicly pushed back against SEC Chair Gary Gensler’s lack of focus on urgent digital asset-related matters. This internal row, however, changed little in the agency’s usual policy of delaying decisions on Bitcoin (BTC) exchange-traded funds (ETF). Two products sponsored by investment firms Bitwise and Grayscale were denied certainty for another few months. Finally, on the SEC, the regulator’s former head, Jay Clayton, came out of the woodwork to laud “cryptocurrency technology” and its efficiency advantages. Clayton is remembered for his reasonable stances on many crypto-related issues, although regulated Bitcoin ETFs remained out of reach during his tenure.

Čítaj viac

Overheated DOGE: 5 times crypto traders were warned before their assets tanked

Everybody loves a crypto bull market, but every green wave inevitably gives way to periods of sideways or downward movement.Skilled traders know that these phases of the market cycle can be rife with profit opportunities, too. Anticipating not only a digital asset’s upward price movements, but downturns and corrections can be useful when deciding on when to exit a position and lock in gains, as well helping to add toprofits by shorting crypto assets whose prices decline.In addition to a keen eye and common sense, anticipating price drops can be aided by data intelligence tools. One AI-driven indicator that can help investors see the signs of an upcoming dip early is the VORTECS™ Score, exclusively available to the members of Cointelegraph Markets Pro.Its job is to sift through years’ worth of historical data and identify whether the combination of market and social conditions around each asset looks like those that preceded sharp upward or downward price action in the past.At any given moment, a cryptocurrency token’s high VORTECS™ Score means that its outlook is historically bullish; but low scores below 30 indicate that in the past, the observed patterns were often followed by price drops.Red VORTECS™ Scores are much rarer than dark-green ones. The most common scenario where such scores can be observed is when crypto assets see flash rallies, get overbought, and then see massive corrections.Here are five conspicuous instances of red VORTECS™ Scores flashing on crypto assets before their prices tanked.DOGE: Memecoin gets overheatedVORTECS™ Score (green/red) vs. DOGE price, Apr. 8 – 15. Source: Cointelegraph Markets ProDogecoin (DOGE) presented an instance of very high and very low VORTECS™ Scores following each other closely in the week of Apr. 8.The asset’s score went above 80 on the morning of Apr. 13, when the price curve was still flat at around $0.073 (first red circle). Apparently, the model has sensed a familiar arrangement of celebrity tweets and rising trading volume. Less than 12 hours later, the price line followed suit, pumping all the way to $0.141.Even before the price reached its peak value, however, the algorithm signaled that historically Dogecoin’s rallies were followed by rebounds, as the VORTECS™ Score dipped into the red area below 30. A correction to $0.110 followed in several hours.While the VORTECS™ Score is not designed to tell investors when to go long or short, it can provide a useful indication of historically bullish or bearish conditions for a particular asset — information that can be profitably incorporated into a trading strategy.COTI: Massive spike, hard comedownVORTECS™ Score (green/red) vs. COTI price, Aug. 21 – 27. Source: Cointelegraph Markets ProFollowing a sharp hike from $0.29 to $0.45 within an hour that occurred on Aug. 26, the price of COTI began to succumb to a correction.It quickly dropped to $0.37 and then attempted to gain upside traction again as it rose to $0.42. At this point, the VORTECS™ algorithm recognized similarities between the observed conditions and COTI’s past price corrections, lighting up a red score (red circle in the graph) when the price was still on its way up. The flash was well-placed, within two hours, COTI reversed its course and fell back to around $0.35.NEAR: A dip or second leg up?VORTECS™ Score (green/red) vs. NEAR price, Sept. 5 – 12. Source: Cointelegraph Markets ProBetween Sept. 7 and 9, NEAR Protocol soared from $6.00 to $11.58 within three days. The question on all crypto traders’ minds was: Where will NEAR go next? Several hours after the price peak, the token’s VORTECS™ Score dipped below 30 (red circle in the graph), informing Markets Pro subscribers that historical precedent suggested an imminent decline rather than another leg of the rally.NEAR’s price was at around $11.00 and still going up when its score flashed red; 36 hours later, it was down to $9.00NMR: Red Score at a price peakVORTECS™ Score (green/red) vs. NMR price, Apr. 2 – 8. Source: Cointelegraph Markets ProNumeraire (NMR) was doing great on April 4 and 5, and its price was still headed toward the peak of $78.07 when its VORTECS™ Score dropped below 30 (red circle in the graph). This suggested that in the past NMR’s similar rallies were followed by the price cooling off quickly. Sure enough, the correction kicked in in less than two hours after the lowest Score, NMR’s price sliding back to around $63.00 within the following two days.STX: Green before price rises, red before it dropsVORTECS™ Score (green/red) vs. STX price, Oct. 7 – 14. Source: Cointelegraph Markets ProIn the week of Oct. 8, Stacks (STX) managed to light up both an ultra-low and ultra-high VORTECS™ Scores, all within two consecutive days. On Oct. 9-11, STX had seen a strong rally from $1.44 to $2.29, after which the token’s price began to decline.At that point, the VORTECS™ algorithm recognized a combination of factors that in the past preceded extended corrections, flashing a red score (first circle in the chart). Indeed, STX soon embarked on a downward trajectory for the following 30 hours, dipping all the way back to $1.86.However, in the middle of the pullback, the coin’s VORTECS™ Score went up sharply, reaching a high of 88 against a still-declining price. Apparently, market and social conditions around the coin flipped bullish again as in the past similar massive corrections were followed by even greater upsides.Sure enough, 16 hours after the peak VORTECS™ Score of the week had been registered, STX’s rally resumed toward the week’s high price at $2.39.Cointelegraph Markets Pro’s VORTECS™ Score is available to members here.Disclaimer. Cointelegraph is a publisher of financial information, not an investment adviser. We do not provide personalized or individualized investment advice. Cryptocurrencies are volatile investments and carry significant risk including the risk of permanent and total loss. Past performance is not indicative of future results. Figures and charts are correct at the time of writing or as otherwise specified. Live-tested strategies are not recommendations. Consult your financial advisor before making financial decisions.

Čítaj viac

Získaj BONUS 8 € v Bitcoinoch

nakup bitcoin z karty

Registrácia Binance

Burza Binance

Aktuálne kurzy