Autor Cointelegraph By Beau Linighan

Here is how studying tokens’ price history helps patient traders enjoy consistent average gains.

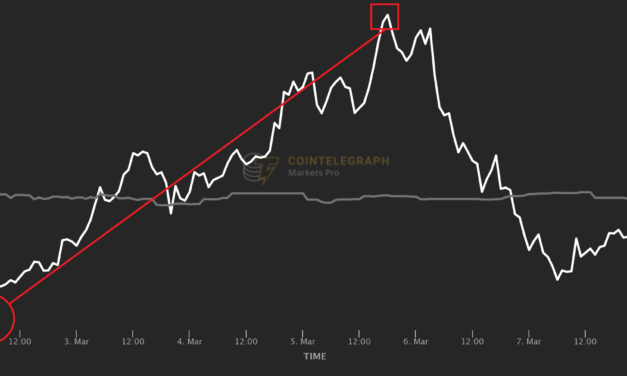
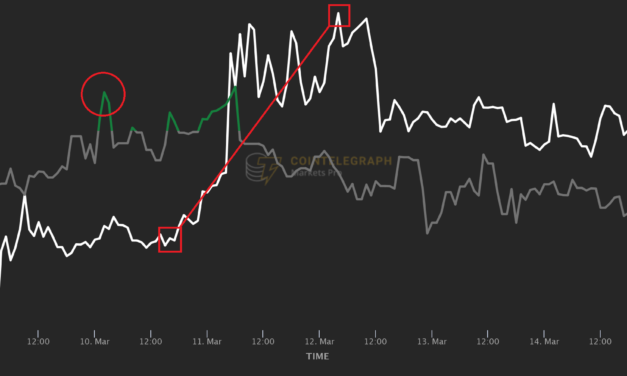
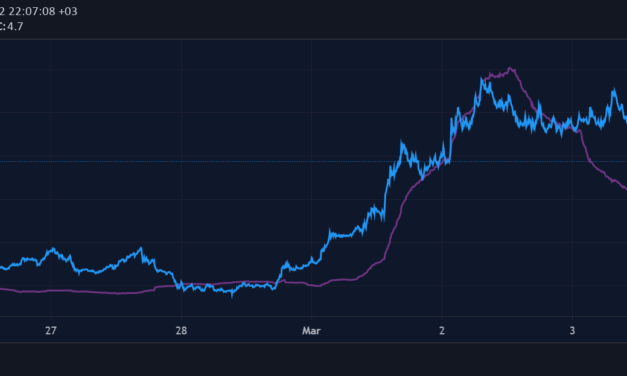
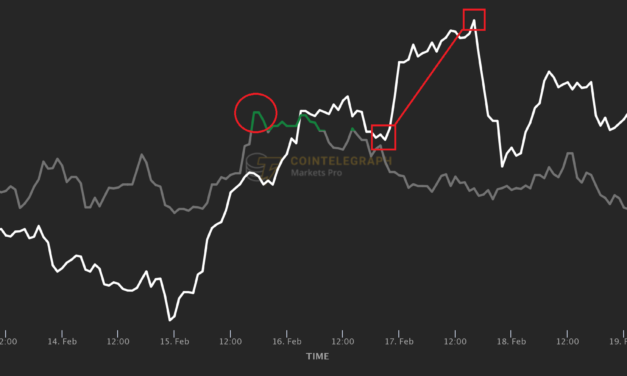
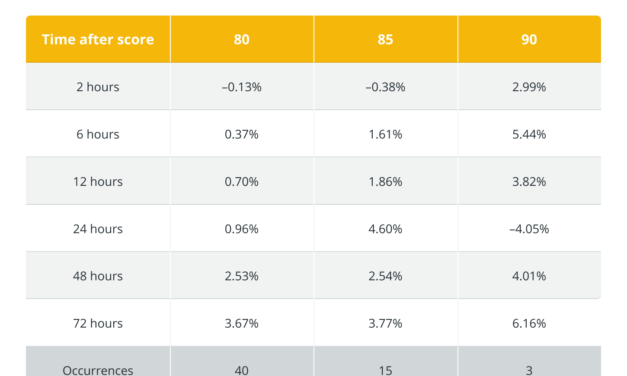
Whether you consider cryptocurrency trading as art, science or a game of skill, one thing is beyond dispute: Those who excel at it are not the traders who maintain the longest series of lucky one-offs but those who establish sustainable trading processes yielding consistent returns.Ask a sample of seasoned pros if they would prefer to catch one obscure token’s 300%-in-a-day brush with fame or learn a strategy that systematically generates a 3% return on investment. You will be surprised how many of them (likely close to 100% of the sample) prefer modest yet systematic profits.How does one make their trading processes more systematic? One way is to rely on automated data analytics tools with a proven track record of consistent performance. One such tool is the VORTECS™ Score, an artificial intelligence (AI)-powered algorithm exclusively available to the subscribers of Cointelegraph Markets Pro. Its job is to compare the current combination of trading and social metrics around each crypto asset to past ones, giving traders a heads-up when historical conditions begin to look ripe for a rally.Here are some numbers from an average week in the March sideways market. To understand what they mean, you only need to wrap your head around two simple notions. First, the higher the token’s VORTECS™ Score, the more favorable its outlook is, historically speaking. Scores of 80 and above are conventionally considered to be strongly bullish. Meanwhile, Scores above 90 indicate the algorithm’s extreme confidence that, in the past, similar patterns consistently showed up ahead of massive rallies.Second, the algorithm is designed to detect patterns of trading activity and social sentiment that in the past preceded big upsides by 12 to 72 hours. On average, assets tend to perform better after longer times from hitting high Scores.The data from this week largely supports this observation. As the table shows, forty coins that hit the VORTECS™ Score of 80 added an average of 2.53% of value 48 hours after reaching the threshold and 3.67% after 72 hours. The average gains generated by the assets that hit the Score of 90 are less reliable because they are based on only three observations: nineties occur way less frequently than eighties. Nevertheless, in most weeks, nineties outperform eighties, as was the case this week.GET MARKETS PRO RIGHT NOWThis week’s average returns are representative of the broader picture of how the VORTECS™ algorithm performs. Over one year between January 2021-2022, crypto assets that reached the Score of 80 delivered an average gain of 2.45% after 72 hours. The 90-hitters yielded 4.46% after 72 hours.While these numbers may look modest, more than a year’s worth of observations speak to their consistency. This makes the VORTECS™ Score a sound addition to the arsenal of those who wish to make their trading strategies more systematic.Cointelegraph is a publisher of financial information, not an investment adviser. We do not provide personalized or individualized investment advice. Cryptocurrencies are volatile investments and carry significant risk including the risk of permanent and total loss. Past performance is not indicative of future results. Figures and charts are correct at the time of writing or as otherwise specified. Live-tested strategies are not recommendations. Consult your financial adviser before making financial decisions.

Čítaj viac

3 times in March that savvy crypto traders bought breaking news for the price of a rumor

As an old saying goes: Buy the rumor, sell the news.As a digital-native asset class, the prices of cryptocurrencies are clearly susceptible to market-moving news developments that instantly spread on the internet. Staying on top of bullish announcements can help crypto traders reap huge gains, but navigating the crypto news landscape can be daunting.Two major roadblocks get in the way: the abundance of potentially relevant information and the difficulty of making sure one is always among the first to learn the news that really matters. Extensive research shows that three types of crypto-related developments move digital asset prices most consistently: listings, staking announcements and big partnerships. This insight somewhat narrows down the scope of the developments that will most interest traders.Now, what is the best way for crypto folks to ensure that they get to the potentially consequential stories before the rest of the pack? There is no shortage of technological solutions, from carefully curating one’s list of Twitter alerts to various crypto data terminals.The subscribers of Cointelegraph’s proprietary data intelligence platform, Markets Pro, have it easy. They get access to NewsQuakes™ — a machine learning service that constantly monitors thousands of primary sources and automatically notifies the Cointelegraph Markets Pro community within minutes or even seconds of publication.Here are three examples of how Cointelegraph Markets Pro subscribers could have capitalized on the power of NewsQuakes™ in March.ANC: Staking program announcement kicks off a rallyANC price (white), March 2–8. Source: Cointelegraph Markets ProStaking announcements can be powerful market movers, especially when a staking program for an asset launches on a major platform and comes with attractive terms. Anchor Protocol’s launch on Binance Staking with up to 40% annual percentage yield on ANC fit the bill perfectly. The announcement, delivered to Cointelegraph Markets Pro subscribers as a near-instant NewsQuake™, was sourced from Binance’s Twitter account. The token was trading at $3.79 when the news hit, picking up steam quickly thereafter. Eighteen hours later, ANC’s price reached $4.90 and then pushed even higher to breach the $6.00 mark by March 5.SNX: A double-barreled listing announcementSNX price (white), March 5 – 12. Source: Cointelegraph Markets ProAnother fateful tweet put huge upside pressure on the price of Synthetix Network Token (SNX). The news concerned SNX’s listing on Binance.US. Interestingly, there were two Twitter announcements of the upcoming listing, but apparently, the first one (the first NewsQuake™ symbol in the chart on March 8) did not produce much of a splash. However, the news of the actual launch of SNX trading (the red circle in the chart) made SNX’s price spike from $3.98 to $4.77 within 23 hours — an increase of 19.8%.SAND: A big partnership spells big gains SAND price (white), March 11 – 18. Source: Cointelegraph Markets ProPartnership announcements tend to show up a bit less frequently among the most consequential NewsQuakes™ when compared with listing and staking news. Sometimes, however, there are partnership deals whose price-boosting effects eclipse those of most other NewsQuakes™. A rule of thumb is that if you have heard of a non-crypto entity that is partnering with a crypto project, the associated token’s price is likely to go up.Banking giant HSBC is certainly an institution familiar to most traders. Its move into the Metaverse, facilitated by The Sandbox, was something that stood to trigger a massive upside for the SAND token. Sure enough, SAND’s price shot up almost vertically minutes after the Cointelegraph Markets Pro crowd was alerted to the news, spiking from $2.85 to $3.28 (a 15% increase) in just 18 hours.Cointelegraph is a publisher of financial information, not an investment adviser. We do not provide personalized or individualized investment advice. Cryptocurrencies are volatile investments and carry significant risk including the risk of permanent and total loss. Past performance is not indicative of future results. Figures and charts are correct at the time of writing or as otherwise specified. Live-tested strategies are not recommendations. Consult your financial adviser before making financial decisions.

Čítaj viac

XHV, RUNE, REQ: Here’s how you can be tipped off to the week’s winners before they post strong gains

The mixed crypto market that took hold starting late last year does not offer as many profit opportunities as the blooming altcoin season that came before it. There are way fewer winners than in bull times, and the thorough research needed to single them out can become a full-time job. Luckily, there are ways to outsource some of this effort.The history of digital assets’ price action doesn’t hold keys to their future, but it can offer numerous valuable cues. Complex patterns of trading and social sentiment metrics that power a token’s dramatic price pumps often recur, and savvy traders can use them to anticipate price moves.One of the tools that can read the history of assets and turn it into actionable insight is the VORTECS™ Score. Exclusively available to the subscribers of Cointelegraph Markets Pro, this machine learning tool shows whether the present combination of market and social metrics for each tracked coin is historically bullish, bearish or neutral.The higher the Score, the more bullish the token’s outlook for the next 12 to 72 hours. Scores of 80 and above are considered confidently bullish, meaning that the current trading conditions look very similar to those that showed up ahead of huge price spikes in the past.Here is how it worked out with some of this past week’s top-performing digital assets.XHV: The offshore bank of crypto goes to the moonVORTECS™ Score (green/gray) vs. XHV price (white), March 8 – 15. Source: Cointelegraph Markets ProHaven Protocol, a Monero fork that markets itself as an “offshore bank” without a bank, saw its Haven (XHV) cryptocurrency experience a major price pump on the news of Western sanctions against Russia and the general narrative of financial privacy gaining momentum. Haven is a privacy-focused “ecosystem of untraceable assets” that allows for the anonymous exchange of assets.The patterns of trading and social activity shaping up around the token began to look historically bullish on March 10 as XHV’s VORTECS™ Score peaked at 88 against a price of $2.37. Nineteen hours later, the asset’s price pumped, reaching $3.73 in just 11 hours.RUNE: Robust fundamentals produce a bullish patternVORTECS™ Score (green/gray) vs. RUNE price (white), March 8 – 15. Source: Cointelegraph Markets ProTHORChain’s RUNE sported strong fundamentals rolling into the week. The token’s first upside came on March 10 in response to the network activating synthetic assets, with RUNE marching all the way up to a local high at $5.52. Shortly thereafter, its VORTECS™ Score hit 84, suggesting that the best was yet to come, according to historical precedent.Sure enough, the recurring pattern didn’t lie: The rally continued to unfold further, boosted by the news that THORChain would launch its new Thorfinance protocol in addition to a native stablecoin. RUNE’s price embarked on a steep upward trajectory some 40 hours after the VORTECS™ peak was registered, with its price leaping from $5.64 to $7.94 over the rest of the week.REQ: Strong trading conditions foreshadow a flash rallyVORTECS™ Score (green/gray) vs. REQ price (white), March 8 – 15. Source: Cointelegraph Markets ProREQ is the native token of Request Network, a decentralized payment system built on Ethereum. The asset’s price spiked on March 13 and 14 in a two-legged rally following the addition of support for Jarvis Network’s euro-pegged stablecoin, jEUR. The favorable news environment contributed to a bullish arrangement of trading metrics and social sentiment indicators, captured by a peak VORTECS™ Score of 82 lighting up on March 14. Eleven hours later, the favorable outlook materialized in a pump from $0.20 to $0.25 in under four hours.No algorithmic trading indicator can present a comprehensive picture of what is going on with a token and where its price is poised to move next. However, combining the insight from a data-powered tool like the VORTECS™ Score with analysis of fundamentals and the news environment can help traders identify big winners hours before their powerful upsides kick in.Cointelegraph is a publisher of financial information, not an investment adviser. We do not provide personalized or individualized investment advice. Cryptocurrencies are volatile investments and carry significant risk including the risk of permanent and total loss. Past performance is not indicative of future results. Figures and charts are correct at the time of writing or as otherwise specified. Live-tested strategies are not recommendations. Consult your financial adviser before making financial decisions.

Čítaj viac

Here’s how traders were alerted to RUNE’s, FUN’s, WAVES’ and KNC’s big rallies last week

A digital asset’s price rally rarely comes out of the blue. Before the token’s market value explodes, some collateral forces come into motion. The asset can suddenly attract abnormally high online attention, its trading volume can go up dramatically, or some market-moving information can go public that triggers the first two examples. Mastering the art of crypto trading means learning to see those subtle cues early on.Spiking trading volume is one of the signs that something interesting might be brewing around a crypto asset. Often, trading volume simply follows a price trend, with the coin entering a virtuous circle where its rallying price attracts more traders, boosting the volume accordingly. In other cases, abnormally high volume points to robust liquidity and rising investor interest, which can underpin further waves of appreciation.One of the ways to get alerted to potentially informative trading volume pumps is the Unusual Trading Volume bar on the dashboard of Cointelegraph Markets Pro, Cointelegraph’s subscription-based data intelligence platform.Last week, four out of the 10 tokens that showed the greatest increase in week-to-week trading volume flashed weekly volume highs before their prices peaked. Here’s how traders could have profitably put this information to work.RUNE: Big news boosts both trading volume and priceRUNE price (blue) vs. trading volume (purple), Feb. 25 – March 4. Source: TradingView/The TIETHORChain’s RUNE had a big week, with a Terra integration and upcoming mainnet launch exerting huge upside pressure on the token’s price. The breakthrough moment came on March 1 when RUNE took off from around $3.70 and breached $5.80 in less than a day. Trading volume spiked alongside the price, with the highest volume of the week coming after the first price peak. Traders who took heed of the volume dynamics were in for a continued rally, as the token’s price remained up, breaching the $6 mark on March 4.FUN: Two trading volume pumps amid a rolling rallyFUN price (blue) vs. trading volume (purple), Feb. 25 – March 4. Source: TradingView/The TIEThe price of Funfair’s FUNToken (FUN) steadily went up throughout the entire week, with two trading volume spikes reassuring traders that strong fundamentals fueled the token’s appreciation. The first came on Feb. 28 and preceded a local price peak at $0.0103 registered on March 1. Two days later, an even larger trading volume wave hit, foreshadowing the week’s price high of $0.0105.WAVES: Volume spikes following price pump, anticipates even bigger oneWAVES price (blue) vs. trading volume (purple), Feb. 25 – March 4. Source: TradingView/The TIEWAVES added upward of 80% to its value over last week, thanks to the Waves platform’s ongoing transition to version 2.0, a bullish partnership with Allbridge that will ensure cross-chain interoperability, and the news of the launch of Waves Labs, a $150 million fund that will support the project’s growth in the United States market. On March 1, the token’s price soared from around $13 to over $19 in less than a day, triggering a corresponding pump in trading volume. Even as the wave of liquidity subsided, the price action remained robust, with the token’s valuation going further up to its weekly high at $20.86.KNC: Strong price momentum following trading volume spikeKNC price (blue) vs. trading volume (purple), Feb. 25 – March 4. Source: TradingView/The TIEKyber Network Crystal (KNC), the utility and governance token of Kyber Network, massively rallied on Feb. 28, dragging the token’s trading volume with it. The volume peaked against a price of $2.51, but the feast carried on as the price continued to soar all the way up to $2.91.Cointelegraph Markets Pro’s Unusual Trading Volume panel, March 10. Source: Cointelegraph Markets ProIn addition to the raw data on trading volume outliers available on the Cointelegraph Markets Pro dashboard, the trading volume metric is one of the core components of the VORTECS™ Score. An algorithmic tool for comparing historical and present market conditions around digital assets, the VORTECS™ Score can be used to identify historically bullish or bearish setups around each digital asset it tracks, alerting traders to the coins with the most favorable outlooks.Cointelegraph is a publisher of financial information, not an investment adviser. We do not provide personalized or individualized investment advice. Cryptocurrencies are volatile investments and carry significant risk including the risk of permanent and total loss. Past performance is not indicative of future results. Figures and charts are correct at the time of writing or as otherwise specified. Live-tested strategies are not recommendations. Consult your financial adviser before making financial decisions.

Čítaj viac

Even in a choppy crypto market, this algorithmic indicator helped traders identify the few winners

Just as it started to look like the crypto market was staging a comeback and bracing for a new bull run, geopolitical tensions stepped in to drive the price of Bitcoin (BTC) below $40,000 again, with most altcoins seeing deep red as well. Such periods of market uncertainty, however, are not unprecedented, and digital assets’ individual history already holds information on the way their prices previously behaved under similar macro conditions.Last week was not rich with impressive altcoin rallies, as the crypto market seesawed along with the twists and turns of the news cycle. Still, several assets that recorded solid price performances did so after showing off strong historical trading conditions. Here is how crypto traders could have detected these favorable outlooks and put them to use.Detecting history’s rhymesThe VORTECS™ Score is an automated data intelligence tool, exclusively available to the subscribers of Cointelegraph Markets Pro, designed to spot assets’ individual conditions that in the past consistently appeared before big rallies. It looks at a menu of inputs — trading volume, price movement, tweet sentiment and others — and constantly compares their current combination to the asset’s historical performance data.The more the algorithm is confident that the outlook is historically bullish, the higher the token’s VORTECS™ Score at any given moment. Scores of 80 and above appear when the model has strong confidence that the arrangement of data points looks very similar to those in the past that came in 12 to 72 hours before price spikes.Of course, individual data patterns are to some extent correlated to the price of Bitcoin and the trends in the broader market; the rest of the variance, however, is unique to each token, providing useful information on the way a particular asset tends to behave under similar marketwide conditions.Here’s how it played out last week with Telos’s TLOS, Unifi Protocol’s UNFI and Avalanche’s AVAX.TLOS: Anticipating a second leg upVORTECS™ Score (green/gray) vs. TLOS price, Feb. 12 – 19. Source: Cointelegraph Markets ProTelos’ TLOS coin has had a tremendous stretch so far this month. Last week, it offered an illustration of a classic “second leg up” scenario wherein a bullish VORTECS™ Score lights up on an asset that has just seen a strong rally. Indication of a bullish outlook usually comes during a subsequent correction or a period of sideways price movement.On Feb. 15, the token appreciated from $0.92 to $1.06 in 16 hours, after which its price hung in the balance. At this point, TLOS’ historical trading outlook began to look increasingly favorable. A VORTECS™ Score of 81 suggested that in the past, similar combinations of price movement and other trading and social conditions were often followed by further upside. This time, it happened again: After a five-hour pause, TLOS resumed its rally, rising all the way to $1.21.UNFI: Robust outlook foreshadowing a long rallyVORTECS™ Score (green/gray) vs. UNFI price, Feb. 12 – 19. Source: Cointelegraph Markets ProUnifi Protocol and its UNFI token entered the spotlight at the end of January when it was picked up by Coinbase despite its relatively low market capitalization. The token saw a three-day-long rally in the middle of last week, although by Friday, a marketwide correction wiped out much of UNFI’s gains. Some 18 hours before the price hike began on Feb. 14, traders were alerted to a favorable trading outlook shaping up around the token as its VORTECS™ Score hit 82 (red circle in the chart). The asset’s price briefly dipped thereafter, yet it wasn’t too long before it embarked on an upward trajectory that took it from $4.89 on Feb. 14 to $5.67 by Feb. 17.AVAX: Heads-up to an incoming price peakVORTECS™ Score (green/gray) vs. AVAX price, Feb. 12 – 19. Source: Cointelegraph Markets ProAvalanche’s native AVAX coin first showed moderately bullish trading conditions on Feb. 13, although its VORTECS™ Score fell short of breaking the conventional cutoff threshold of 80, only reaching 76 that day. Still, the asset soon broke out as its price shot up from $76 to $89 in less than 40 hours. As AVAX continued to rally, its historic outlook became highly favorable again, with the peak Score of 82 lighting up against a price of $92.15. This suggested that there still was more to the ongoing rally. Sure enough, AVAX’s price continued to soar and reached its weekly peak of $98.44 in 22 hours.GET MARKETS PRO RIGHT NOWMore than a year’s worth of data suggests that focusing on tokens that hit the VORTECS™ Score of 80 and beyond is an efficient strategy for identifying a range of assets with a solid chance of performing well within the next few days. This automated historical analysis yields the greatest results when combined with other analytical tools and strategies, such as various forms of technical analysis. While it is not a guarantee of future price movement, the VORTECS™ Score has proved to be a useful tool for asset discovery and detecting the early signs of impending rallies.Cointelegraph is a publisher of financial information, not an investment adviser. We do not provide personalized or individualized investment advice. Cryptocurrencies are volatile investments and carry significant risk including the risk of permanent and total loss. Past performance is not indicative of future results. Figures and charts are correct at the time of writing or as otherwise specified. Live-tested strategies are not recommendations. Consult your financial adviser before making financial decisions.

Čítaj viac

Získaj BONUS 8 € v Bitcoinoch

nakup bitcoin z karty

Registrácia Binance

Burza Binance

Aktuálne kurzy