Autor Biraajmaan Tamuly

Bitcoin capitulation ‘twice as weak’ after spot liquidity turns supportive: Glassnode

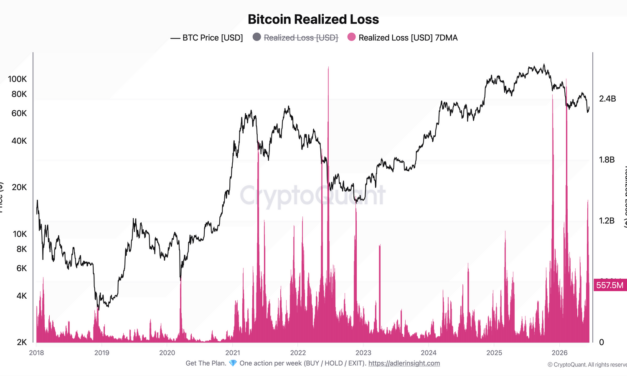
Bitcoin’s (BTC) latest bout of panic selling produced significantly smaller realized losses than those seen during the February correction. Realized losses peaked at $1.4 billion during the June decline, compared to $2.6 billion in February, while the buy-side liquidity on Binance strengthened above recent lows at $60,000, according to Glassnode. BTC realized drop 46% from February highsBitcoin’s realized profit-to-loss ratio has fallen into capitulation territory, signaling that loss-taking continues to outweigh profit-taking across the market. The 30-day smoothed ratio currently sits near 0.28, one of the lowest readings of the year.However, the magnitude of those losses tells a different story. Bitcoin’s seven-day moving average realized loss peaked at $2.6 billion during February’s sell-off. The June decline reached $1.4 billion before cooling to approximately $558 million.Bitcoin Realized Loss. Source: CryptoQuantThe gap between the two events highlights a notable shift in traders’ behavior. Fewer investors are choosing to sell at a loss despite another period of market stress, where BTC prices range near identical levels.Crypto analyst Axel Adler Jr. described the current episode as the second wave of panic selling in 2026. The analyst noted that realized loss data shows the latest capitulation is “almost twice as low” as February’s event. Glassnode’s capital flow metrics also show pressure easing on the price. The realized cap, which measures the aggregate cost basis of all circulating Bitcoin, stands at $1.07 trillion. The metric has declined by 1.45% over the past 90 days, indicating a steady withdrawal of capital.The realized cap’s seven-day change has narrowed to -0.18%, indicating that capital outflows have nearly stalled compared to Q1. Related: Bitcoin price sets $64.5K week-to-date low as Strategy selling worries returnBitcoin spot orderbooks turn supportiveAccording to Glassnode, Binance’s spot orderbook depth imbalance has shifted decisively toward bids, with a ratio of 0.8, with buy-side liquidity exceeding resting sell orders by the widest margin since December 2025. The change signals a stronger demand to absorb supply during pullbacks rather than distribute into rallies.BTC: spot orderbook depth imbalance. Source: GlassnodeAt the same time, the derivatives positioning has become less aggressive. Bitcoin’s open interest (OI) on Binance recorded one of its largest daily reversals since April. Open interest shifted to -$620 million, from $258 million over the past 24 hours, marking a net reversal of nearly $878 million. For now, the strongest improvement is visible in spot liquidity. Glassnode added,“Although this alone is insufficient to confirm a durable bottom, the emergence of strong buy-side depth suggests spot market participants are becoming more willing to defend current price levels.”Related: Bitcoin is setting up ‘meaningful floors’ in $60K–$70K range: Analyst

Čítaj viac
Altcoin selling tops $266B as capital rotates out of crypto: Is altseason extinct?

Altcoin markets (excluding Ether (ETH)) recently saw $266 billion in net selling volume on centralized exchanges, the deepest reading since the metric began tracking spot demand in 2020.Altcoins accounted for 51% of Binance futures trading volume on June 16, compared with 28.85% for Bitcoin and 20.20% for Ether, positioning the exchange as a leader in derivatives activity in 2026.The divergence between record selling and dominant trading activity points to capital rotating within crypto and also into alternative exchange products.Altcoin trading stays active despite outflowsCrypto analyst IT Tech noted that the one-year cumulative buy-sell difference for altcoins, excluding Bitcoin (BTC) and Ether (ETH), dropped to -$266 billion on June 16. One-year cumulative buy-sell volume for altcoins. Source: CryptoQuant The current readings show that selling pressure has outweighed buying demand for an extended period, pushing the cumulative balance to a new low.However, altcoin trading activity tells a different story. Data shows altcoins accounted for 51% of daily futures trading volume on June 16, compared with 28.85% for Bitcoin and 20.20% for Ether. Altcoins have led exchange trading volumes for most of 2025, aside from a brief period in February when Bitcoin overtook the sector.Volume dominance between BTC, ETH, and altcoins. Source: CryptoQuantThe combination of elevated futures trading activity and deeply negative spot demand points to capital recycling within the altcoin market rather than fresh spot inflows. This shows investors continuing to trade altcoins, although aggregate spot purchases have not kept pace with the selling volume.Related: BitGo courts crypto firms awaiting MiCA approval amid Binance licensing concernsCrypto liquidity shifts beyond altcoinsMarket analyst MorenoDV indicated that exchange stablecoin balances have changed little since December 2024. The exchange supply ratio for ERC-20 stablecoins has fluctuated between 0.40 and 0.46, meaning roughly 40% to 46% of circulating stablecoins have stayed on exchanges for more than a year.Stablecoins (ERC20) exchange supply ratios. Source: CryptoQuantDuring the same period, Bitcoin experienced price swings exceeding 50%, trading between $60,000 and $120,000. Binance held between 25% and 30% of the total stablecoin supply, accounting for more than half of exchange-held reserves. This indicates liquidity has stayed available, but capital deployment has become increasingly selective.Part of the capital appears to be targeting traditional asset products offered by crypto exchanges. According to CryptoQuant, metals futures volume peaked at nearly $500 billion in March 2026, as gold and silver prices reached record highs. The trading activity in pre-IPO perpetual products expanded to $715 million in May and $2 billion in June, up from just $2 million in March.Binance processed $10.3 billion in pre-IPO perpetual volume in June, roughly 20 times higher than the entire month of May, while controlling about 83% of the segment. Growth in metals, oil, equities, and pre-IPO contracts highlights how exchange users are increasingly allocating liquidity across a wider range of assets, with Binance continuing to hold the largest concentration of deployable stablecoin capital.Related: Hyperliquid open interest surges 32% in week: Is $80 HYPE next?

Čítaj viac

Bitcoin metric near ‘low-risk’ zone after holders absorb 125K BTC in June: Time for a rebound?

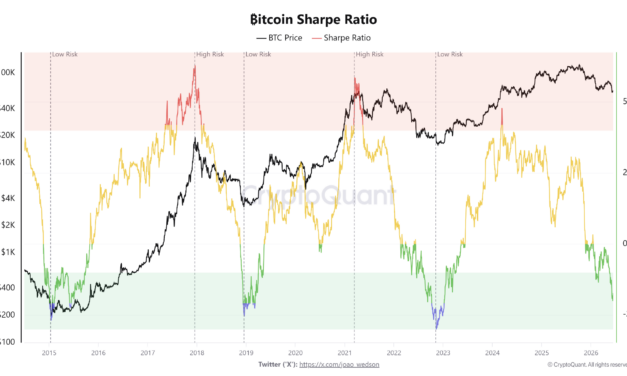
Bitcoin’s (BTC) risk-adjusted return profile is approaching levels historically aligned with long-term accumulation zones. The Sharpe ratio, a metric that measures return relative to volatility, dropped to -20, a threshold that marked major Bitcoin bottoms in every bear market since 2015. At the same time, BTC exchange reserves have fallen by roughly 80,000 BTC since February, while demand from accumulator addresses more than doubled to 240,000 BTC from 115,000 BTC during the first two weeks of June. BTC’s Sharpe ratio revisits a historical bottom zoneBitcoin’s Sharpe ratio reached -20 on June 11, a level that coincided with major cycle lows over the past decade. The metric first dropped below the threshold on Jan. 5, 2015, and remained there until June 12, when BTC established a durable bottom and entered a recovery phase.A similar pattern emerged between Dec. 8, 2018, and March 7, 2019, when the Sharpe ratio spent most of the three months below -20 during Bitcoin’s bear market floor. The metric repeated the signal from Oct. 7, 2022, through January 7, 2023, shortly before BTC began its next sustained bullish period. Bitcoin Sharpe ratio. Source: CryptoQuantWhile no single metric identifies market bottoms with precision, periods below -20 have typically coincided with extended accumulation phases for BTC.Onchain data points in the same direction. Bitcoin held on exchanges has declined to 2.71 million on Monday from 2.79 million BTC in February. BTC exchange reserves briefly rebounded to 2.73 million BTC from a yearly low of 2.65 million BTC between late April and early June, though balances have since fallen by about 12,000 BTC over the past two weeks.Demand from accumulator addresses has strengthened during the same period. The cohort absorbed 125,000 BTC between June 1 and June 14. This indicates growing interest among wallets that have a history of holding rather than distributing coins.BTC demand from accumulator addresses. Source: CryptoQuantRelated: Bitcoin’s ‘calm top’ challenges most market bottom estimates: ResearchBitcoin’s consolidation below the key weekly trendline is still developingBitcoin has spent 133 consecutive days below its 100-week simple moving average (SMA), a long-term trend indicator currently located near $88,466.Market cycle data show that Bitcoin often trades below the 100-week SMA for extended periods before reclaiming it. Following the 2013 market peak, BTC spent 378 days below the trendline while consolidating between $200 and $400. During the 2018-2019 bear market, BTC remained below the 100-week SMA for 175 days and traded between $3,000 and $6,000.BTC price, and 100-period weekly SMA trend analysis. Source: Cointelegraph/TradingViewThe longest stretch occurred after the 2022 market decline. Bitcoin remained below the 100-week SMA for 532 days while trading between $16,000 and $25,000.Across those three cycles, Bitcoin spent an average of roughly 362 days under the indicator before reclaiming it and establishing a sustained uptrend. Each period was characterized by prolonged accumulation rather than an immediate recovery.With 133 days already logged below the 100-week SMA, the current cycle is still well below the historical average. Previous examples indicate that consolidation phases beneath the trendline often persist for several more months before Bitcoin reclaims the level.Related: Bitcoin analysis warns over BTC price rejection as $67K approaches

Čítaj viac

XRP whale wallet withdrawals top 720M as risk-adjusted return data points to opportunity

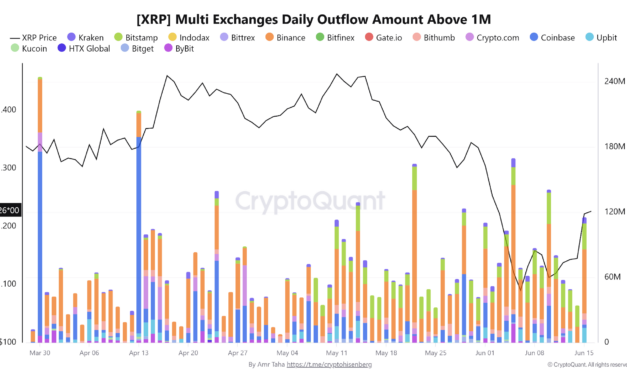
Since June 3, more than 720 million XRP (XRP) tokens have left crypto exchanges, and Upbit’s share of XRP wallet flows has climbed to its highest level since May 2024. The shift comes as XRP rebounded to $1.30 on Monday, with large holder activity continuing to dominate exchange flows and market indicators signal an ideal accumulation period amid lingering weakness. Whales dominate XRP exchange flowsData from CryptoQuant shows that XRP’s multi-exchange daily outflow indicates repeated withdrawals of more than 1 million XRP per transaction. Between June 3 and June 14, major crypto platforms recorded roughly 722 million XRP in large daily outflows, highlighting the most sustained activity from whale-sized wallets since early February. Binance whales led the outflows, with 425 million XRP.XRP exchange daily outflows above 1 million tokens. Source: CryptoQuantWhile large withdrawals do not confirm accumulation, they reduce the amount of XRP immediately available for sale on exchange order books.A separate exchange-flow metric points to a growing concentration of XRP wallet activity on Upbit. According to crypto analyst Amr Taha, Upbit’s XRP net wallet flow dominance climbed to 31% on June 14, up from 13% a week ago, its highest level since May 2024.Taha said XRP’s 5% rebound to $1.30 on Monday coincided with a clear rotation toward Upbit. Deposit-wallet activity became increasingly concentrated on the South Korean exchange while several major platforms lost market share. Another Binance metric shows whales continue to dominate XRP outflows. The Binance Whale vs. Retail Spread measures the difference between whale-sized withdrawals of 100,000 XRP or more and retail-sized withdrawals below that threshold.The spread currently stands near 90%, indicating that large holders still account for the majority of XRP outflows on Binance. Last month, Taha noted that repeated declines toward the May 2024 range suggested a shift in Binance’s withdrawal profile from the 2024-2025 bullish period.XRP’s Binance whale vs. retail spread (%). Source: CryptoQuantWhile the indicator should not be viewed as a direct bullish or bearish signal, the analyst said that it tracks withdrawal behavior rather than exchange selling activity.Related: Trump crypto company’s USD1 stablecoins backing UFC event bonusesXRP Sharpe ratio stays below zero: What does it mean? XRP’s Sharpe ratio remains in negative territory, a zone that has historically aligned with bearish consolidation phases for the asset.This metric evaluates returns relative to volatility, helping assess whether investors are adequately compensated for the risk they take. XRP recorded a Sharpe ratio of -1.097 in September 2022 when the token traded near $0.33. The cycle later peaked near 2.07 in January 2025 as XRP approached $3.14.XRP Sharpe ratio. Source: CryptoQuantThe current reading stands near -0.36, dropping from a positive ratio of 0.18 in May. According to CryptoQuant, XRP has historically produced some of its strongest gains when the Sharpe ratio was negative. The average returns during those periods exceeded 50%, while gains often moderated once the ratio entered positive territory.However, in April, market analyst Teddy said deep negative Sharpe readings for XRP often coincide with periods of “market pain” rather than efficient trends. Those phases have historically created conditions associated with long-term accumulation zones, but further downside remains possible. Related: Bybit expands RWA push with tokenized bond funds from PIMCO, CMBI

Čítaj viac

Získaj BONUS 8 € v Bitcoinoch

nakup bitcoin z karty

Registrácia Binance

Burza Binance

Aktuálne kurzy