Autor Biraajmaan Tamuly

Solana grabs 95% of tokenized equity as traders debate if SOL bottom is in

Solana (SOL) captured 95% of all tokenized equity trading activity across blockchains last week, setting a new record with $1.29 billion in trading volume. The surge comes as SOL trades more than 75% below its all-time high near $295, leaving SOL traders divided on whether the asset is nearing a cycle bottom. SOL onchain activity continues to expand across several metrics, even as a SOL price reversal remains the central focus for market traders.Tokenized equities on Solana hit record activityData shows Solana generated $21 million in weekly app revenue, ahead of Ethereum, Hyperliquid, and Base. Over the past month, Solana applications produced $82.84 million in revenue, compared with $67.43 million on Hyperliquid and roughly $51 million on Ethereum.App revenue generated by chains. Source: DefiLlamaSolana has also led the charge for tokenized equity trading on its chain. Independent reporting from Solana Floor noted that the network recorded its largest week on record for tokenized stock trading, with $1.29 billion in volume, accounting for 95% of activity across all chains.According to Solana Floor, last week’s volume exceeded the total for the entire previous month, driven largely by the release of SpaceX’s IPO token, SPCX. At the same time, the total value locked (TVL) on Solana stands near $5.7 billion. TVL measures the value of assets deposited across decentralized finance applications and serves as a gauge of onchain capital participation.Solana’s TVL chart. Source: DefiLlamaThat figure sits well below Solana’s all-time high TVL of roughly $13 billion from September 2025, showing that capital committed to DeFi applications has not returned to peak-cycle levels despite strong transaction activity and revenue generation.Related: These XRP price charts hint at potential 25% relief rally in JulySOL traders remain split on accumulation timingMarket analysts and traders remain divided on whether SOL has already entered a durable bottoming phase.Crypto trader Ardi said Solana is approaching the area that attracts the trader’s attention for the next bull cycle. Ardi noted that SOL has already fallen about 77% to $60, from its cycle peak near $295. Drawing on historical drawdown compression seen in Bitcoin and Ether, Ardi said an 80%–85% decline would place SOL in the $45-$60 range, the most attractive accumulation zone.SOL/USD, one-week analysis by Ardi. Source: XCrypto trader Bluntz took a more constructive view, arguing that the price forming a weekly bullish divergence with respect to the relative strength index (RSI) following an 80% drawdown often appears near the market lows. The trader implied that SOL could trend higher sooner rather than later based on this setup. Meanwhile, crypto trader Dyme urged caution, noting that Solana spent roughly 500 days from May 2022 to October 2023, building a base before its last major recovery. The comparison suggests that SOL may require a longer period of sideways trading before a durable bottom forms. SOL/USD, one-week chart analysis by Dyme. Source: XTrading Stable founder Ryan Clark also questioned the recent optimism, noting that SOL continues to trade below the key weekly 50-period and 200-period simple moving averages. The analyst, popularly known as HORSE, said that a move back above the $90 region would provide a stronger technical signal. For now, the debate centers on whether demand SOL can build higher before the price reaches the $45-$60. Related: Altcoin selling tops $266B as capital rotates out of crypto: Is altseason extinct?

Čítaj viac
Bitcoin weekly close above $63K amid RSI divergence may be bottom signal: Data

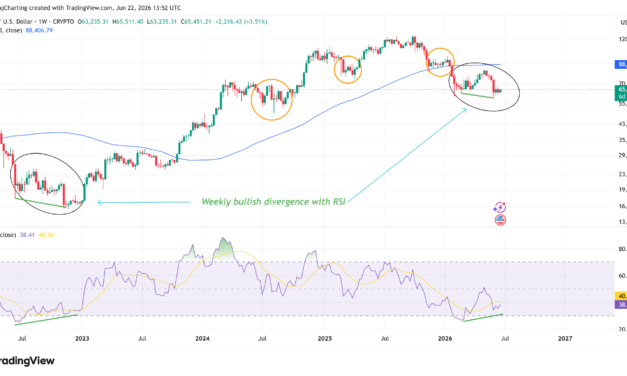
Bitcoin (BTC) continues to exhibit a strong technical setup after holding a weekly close above $63,000 for three consecutive weeks since tagging a new 2026 low near $59,000. This pattern closely resembles a bottom-building phase seen in previous trend reversals in bearish periods.At the same time, Bitcoin futures open interest has fallen 19.5% from its June peak, funding rates have cooled to 0.02% from 0.1%, and spot Bitcoin exchange-traded fund (ETF) outflows have slowed sharply to $540 million over the past two weeks from $5.5 billion the prior month. Together, the data points to a market that is shedding excess selling pressure while holding near a key support zone for BTC. Bitcoin’s weekly chart echoes prior market bottomsBitcoin’s recent weekly price action resembles a pattern seen several times since 2023. Once a local bottom is established, the price often trades close to that range for weeks before a sustained uptrend develops. One exception came in November 2025, when the price spent roughly 10 weeks moving sideways above $88,000 before breaking lower to the $60,000 level. BTC/USD, one-week chart. Source: Cointelegraph/TradingViewThe current setup also resembles the price from late 2022 and early 2023. During that period, the weekly relative strength index (RSI) entered oversold territory, recovered, and later formed a higher low, while the BTC price printed a lower low, creating a bullish divergence. That bullish divergence marked a key turning point, preceding the broader uptrend that developed during 2023. The focus is now on the $63,000 area, where the price has formed a positive RSI divergence. The repeated weekly closes above $63,000, keeps Bitcoin trading above its recent low at $59,000 rather than extending towards it. The behavior fits a range-building phase that has appeared near previous turning points, as identified in the chart. Related: US dollar strength hits highest since May 2025: Five things to know in Bitcoin this weekBTC futures turn less crowded as ETF sell-pressure eases Bitcoin derivatives markets have become notably less crowded over the past three weeks. Bitcoin funding rates cooled to 0.02% from 0.1% at the start of June, reducing signs of aggressive long positioning.Bitcoin funding rate on all exchanges. Source: CryptoQuantCrypto analyst Woominkyuu noted that total Bitcoin open interest across exchanges peaked at $25.96 billion on June 1, then fell to $20.89 billion by June 21. The 19.5% decline exceeded Bitcoin’s 11.4% price drop during the same period.The simultaneous decline in the price and open interest typically signals that existing positions are being closed or liquidated rather than new leveraged bets entering the market. This indicates a significant reduction in excess leverage. It also points to limited evidence of aggressive new short positioning at current levels.Spot Bitcoin ETF flows show a similar shift with $5.5 billion leaving the spot ETFs between May 15 and June 11. The outflows over the past two weeks total about $540 million, marking a sharp slowdown in selling activity.Weekly spot BTC ETF netflows. Source: SoSoValueOnchain data paints a mixed but constructive picture. Bitcoin researcher Axel Adler Jr. highlighted that long-term holders’ realized supply recently reached 12.42 million BTC, a level associated with supply maturation and coins moving into stronger hands. At the same time, Bitcoin’s sales pressure metric has stayed inactive for 1,256 consecutive days, the longest stretch on record. The data points to continued supply maturation alongside other signs that Bitcoin may be stabilizing near a potential cycle low.Bitcoin LTH realized supply. Source: Axel Adler Jr.Related: Strategy adds $300M to USD Reserve, acquires 520 BTC

Čítaj viac

Bitcoin traders expect new lows but data cautions against overly bearish bias

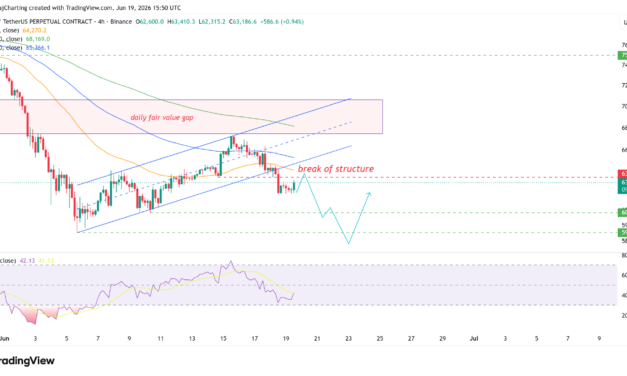
Bitcoin (BTC) is once again approaching its yearly low near $59,000 after a failed recovery attempt left bulls unable to reclaim key resistance levels. BTC traders are now anticipating new lows for 2026 as the price drifts back toward a major support zone.However, exchange inflows from mid-sized investors across Binance and Coinbase recently dropped to their lowest levels since April 4, easing further selling pressure.Liquidation data also shows more than $4 billion in leveraged positions concentrated near the $59,000 level, a setup that may lead to a downside liquidity sweep before a recovery rally towards the $68,000 range. Bitcoin traders target liquidity pocket below $59,000Bitcoin’s recovery attempt stalled before reaching the daily fair-value gap between $67,500 and $70,500. The sellers regained control near the 50-day and 100-day exponential moving averages, which continue to act as overhead resistance.The rejection pushed BTC below an ascending channel, confirming a bearish break of structure on the four-hour chart. The price is currently trading below the channel range, with internal liquidity support near $60,700 as the next area of interest, followed by the yearly low at $59,000.BTC/USD, four-hour chart. Source: Cointelegraph/TradingViewThe liquidation data adds weight to that zone. Around $4 billion in cumulative leveraged long positions is concentrated near $59,000. A move into that area could trigger forced selling and flush out late long positions. Beyond that level, the next major liquidity concentration is near $68,000, where more than $4.75 billion in cumulative positions are clustered.The momentum conditions are also approaching an extreme. The relative strength index (RSI) is hovering near oversold territory. Another push toward yearly lows would likely drive the indicator below 30, a level that may precede a sharp relief bounce after liquidations.Crypto analyst Killa said Bitcoin could still front-run the liquidity pool below $60,000 rather than fully sweeping it. The trader argued that markets often move in the opposite direction of levels that attract widespread attention, similar to how Bitcoin front-ran liquidity above $140,000 in October 2025. BTC trader LP also warned against becoming “too bearish here” in the short term, pointing to a potential bottom forming toward late June.BTC/USD, one-day chart analysis by LP. Source: XRelated: Bitcoin’s deeply discounted versus AI-stocks, but hawkish Fed risk lingers: BitwiseBTC exchange inflows continue to declineAccording to CryptoQuant analyst Amr Taha, inflows from mid-sized Bitcoin investors declined simultaneously across Binance, Coinbase, and Coinbase Prime on June 19. Binance recorded roughly 3,500 BTC in inflows, Coinbase nearly 3,000 BTC, and Coinbase Prime about 1,700 BTC, the lowest readings since April 4.BTC exchange inflow structure by mid-size investors. Source: CryptoQuantExchange inflows are commonly tracked as a measure of potential selling intent. Lower deposits mean fewer coins are being positioned for immediate sale. This indicates one source of near-term sell pressure has eased.The trend does not signal new demand on its own. It shows that mid-sized holders are reducing transfers to trading venues as Bitcoin trades near $62,000. For now, the flow data points to lighter exchange-side pressure even as price tests a major liquidity concentration near yearly lows.Related: Bitcoin tipped for Q3 ‘macro bottom’ near $50K as major liquidity grab looms

Čítaj viac

Ether analysts predict another ‘selling wave’ as ETH struggles to overcome $1.7K

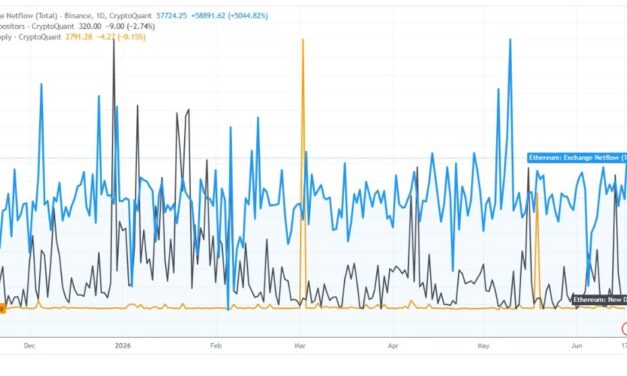
Ether’s (ETH) exchange and derivatives data turned weaker over the past month. Binance recorded net inflows of 57,700 ETH, while futures open interest fell to a year-low of $10.3 billion from $15 billion, and the ratio of leveraged positions retreated sharply from their early June highs. The combination of rising exchange supply, muted new participation, and declining futures activity has led ETH analysts to forecast another wave of selling pressure below $1,700.ETH inflows on Binance outpace new demandCrypto analyst Pelin Ay noted that roughly 57,700 ETH flowed into Binance on a net basis over the past few days. Large inflows to the exchange often signal potential selling since Binance is one of the most liquid exchanges in the crypto market.ETH exchange inflows, new depositors and fresh supply. Source: CryptoQuantAt the same time, the number of new ETH depositors is around 320 addresses, well below the levels seen during previous demand surges. The muted participation suggests limited new capital entering the market, leaving recent price stability dependent on existing holders.The analyst noted that supply growth continues to offer a counterbalance. Daily ETH issuance stands near 2,791 ETH, a relatively low figure since Ethereum’s EIP-1559 upgrade in 2021. For now, exchange flow data paints a cautious picture. Ay said elevated net inflows raise the risk of another selling wave if Ether approaches resistance levels during any relief rally.Related: BitMine boosts ETH holdings closer to $10B as bear market accumulation continuesCan Ether price defend its weekly demand zone?ETH derivatives data have also cooled sharply in recent weeks. Ether futures open interest fell to $10.3 billion on Thursday from $15 billion a month ago, a decline of roughly 31%. The reading marks the lowest aggregate open interest across exchanges since April 2025.Ether estimated leverage ratio for all exchanges. Source: CryptoQuantThe number of leverage positions has also retreated at a similar pace. The estimated leverage ratio (ELR) dropped to 0.83 from an all-time high of 1.10 on June 2, marking its largest leverage unwind since October 2025, when the metric slid from 0.72 to 0.56. Lower leverage often reduces the short-term volatility and speculative demand, but it also signals weaker conviction among traders.ETH/USDT, one-week chart analysis. Source: Cointelegraph/TradingViewEther’s weekly chart is down 30% over the past 42 days and continues to trade near the demand zone of $1,700 and $1,400. The April 2025 low at $1,384 stands as the nearest external liquidity target if price weakness continues. Below that level, the immediate area of interest is the demand zone from January 2023 between $1,289 and $1,071. From a market standpoint, crypto trader Ardi said last week that some technical bottoming signals are emerging for the altcoin. ETH recently touched the lower band of a long-term acceptance range that previously coincided with macro lows. The weekly relative strength index (RSI) sits near 31 after a daily RSI reading of 11 during the recent sell-off, its lowest level on record, which improves the chances of ETH bottoming in the current price range. ETH/USD weekly analysis by Ardi. Source: XArdi added that ETH/BTC remains a key chart metric to monitor, as the pair continues to trend lower. For now, the $1,400 to $1,700 range remains the area where buyers and sellers are most actively positioned.Related: Altcoin selling tops $266B as capital rotates out of crypto: Is altseason extinct?

Čítaj viac
Bitcoin’s deeply discounted versus AI-stocks, but hawkish Fed risk lingers: Bitwise

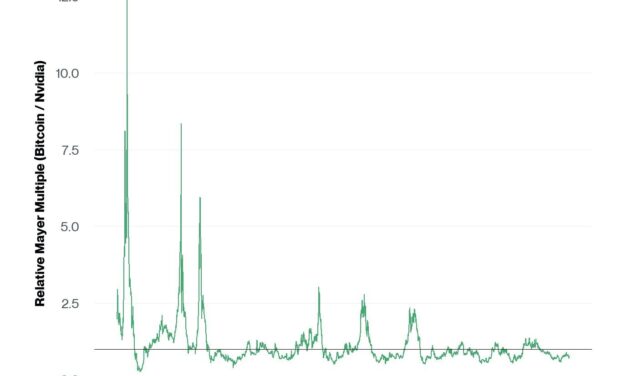
Bitcoin’s (BTC) valuation metrics continue to highlight a deep discount even as markets brace for a potentially hawkish Federal Reserve under new chair Kevin Warsh. Analysis from Bitwise Investments said BTC remains in a “deep value” zone after a valuation metric fell below 1.0, a level associated with long-term accumulation periods.However, investor participation remains subdued, with CryptoQuant’s realized cap growth metric remaining in a bear phase since late October 2025. This points to a steady slowdown in fresh capital entering the BTC network.At the same time, a growing list of key companies going public raises increased competition for liquidity across the investment market, so the focus shifts to whether BTC attracts new capital amid tighter liquidity conditions.Deep-value or liquidity squeeze, which is most important?The Federal Reserve kept interest rates unchanged at 3.5%-3.75% on Wednesday, a decision that largely matched Bitwise’s market expectations and avoided the hawkish surprise the market had feared. While BTC dropped back below $64,000 on Thursday following the Fed’s interest rate announcement, Bitwise described its price as a “deep value” opportunity based on its Mayer Multiple, which compares price to its 200-day moving average. The firm noted the metric had remained below 1.0, a level that has historically aligned with accumulation periods. Bitcoin’s Mayer multiple vs Nvidia. Source: BitwiseBitwise argued that Bitcoin’s valuation stood out compared with AI-linked equities like NVIDIA, which were trading at significant premiums to long-term trend levels. The firm also flagged a growing pipeline of major capital raises, including potential offerings tied to SpaceX, Anthropic, and OpenAI. Collectively, those deals could attract more than $200 billion in investor demand.Large listings often coincide with strong investor appetite. They also absorb liquidity that might otherwise flow into equities and cryptocurrencies. Bitwise said that elevated rates continue to limit the availability of capital for speculative assets despite Bitcoin’s attractive valuation profile.The subdued participation is also reflected in Bitcoin’s capital flow trends. CryptoQuant’s realized cap growth metric has remained in a bear-phase regime since Oct. 30, 2025, even as Bitcoin’s valuation indicators moved into historically attractive territory. Bitcoin’s realized cap growth analysis. Source: CryptoQuantSince entering the bear phase, the metric’s seven-day and 59-day moving averages have declined to 13.9 and 19.1 on June 17 from roughly 70 in Q4 2025. The slowdown suggests the pace of new capital entering the Bitcoin network has continued to weaken, highlighting investor caution.Bitcoin researcher Axel Adler Jr. pointed to a separate concern following the Fed’s decision. While rates remained unchanged, the updated dot plot showed nine officials expecting at least one rate hike this year and six projecting two or more.Bitcoin reacted negatively to the update, with selling volume expanded during the decline on Wednesday, marking the heaviest trading activity at the point of rejection at $66,200. For gold, an initial rebound above $4,300 faded, leaving the metal trading near $4,244 on Thursday.The reaction aligns with Adler’s view that markets are pricing in a higher-for-longer rate path rather than a near-term policy easing. Related: Capital B shareholders approve up to $120B in financing capacity for Bitcoin strategyBTC traders split on the next moveMarket data shows that BTC traders are interpreting the Fed’s outcome in different directions.Market commentator Crypto Rover highlighted a newly opened $38.5 million Bitcoin short position using 30x leverage shortly after the FOMC meeting. The trader was reportedly sitting on roughly $750,000 in unrealized profit as Bitcoin moved lower.Meanwhile, Bitcoin investor Jelle viewed the pullback below $64,000 from the weekly high of $67,255 as a routine retest of support. The analyst identified the $64,000 threshold as a key price point for buyers, adding, “Hold here, and we likely see extended relief into $70k in the coming weeks. Big day ahead.”BTC/USD, one-day analysis by Jelle. Source: XRelated: Bitcoin capitulation ‘twice as weak’ after spot liquidity turns supportive: Glassnode

Čítaj viac

Získaj BONUS 8 € v Bitcoinoch

nakup bitcoin z karty

Registrácia Binance

Burza Binance

Aktuálne kurzy