
Autor Biraajmaan Tamuly

Bitcoin may fall lower but BTC power-law frames crash to $58K as ‘normal’

Bitcoin’s (BTC) drop to $58,000 has pushed the price into a zone that long-term power-law models have historically associated with cycle bottoms. The data does not confirm a bottom range, though it shows BTC trading in a price range that has repeatedly marked major lows since 2014. Derivatives data and liquidation levels highlight $55,000 as the next key support level and the $65,000-$68,000 range as the next major upside area of interest. Bitcoin power-law puts $58,000 in historical rangeGiovanni’s Bitcoin power-law model places the network’s long-term trend price near $135,000, making the recent drop to $58,000 roughly 54% below the all-time high and 1.22 standard deviations beneath that trend.According to the analyst, the key takeaway is straightforward: the previous cycle lows in 2012, 2015, 2019, 2020, and 2022 all fell within a similar statistical range. By that measure, the latest decline falls within a territory that has historically marked the deep bear-market lows rather than a break in Bitcoin’s long-term growth path.Bitcoin price deviation based on the power-law trend. Source: XThe model estimates the commonly referenced “-1σ” support near $68,000, while the stronger historical floor sits closer to $55,000. Giovanni also noted that Bitcoin would need to trade below roughly $17,000 for more than a year before the power-law itself could be considered invalid.A second metric points in the same direction. Bitcoin’s power-law quantile has fallen to 6.2%, indicating the asset is cheaper than roughly 94% of its historical observations when measured against the power-law model. The chart highlights similar readings during the 2015, 2020, and 2023 cycle lows, with the current market now revisiting that historically rare valuation zone.Bitcoin power-law quantile regression chart. Source: CheckonchainRelated: Bitcoin drops to $58K on high US PCE inflation as trader sees ‘manipulation’Key BTC price levels to watchBitcoin fell to a new yearly low of $58,000 after aggressive selling swept through Binance. The hourly taker sell volume reached $2.1 billion, followed by another $1.9 billion in the next hour after the New York market open, marking the exchange’s largest hourly sell pressure since May 4.Bitcoin taker sell volume on Binance. Source: CryptoQuantThe flush liquidated more than $300 million in long BTC positions before the price rebounded toward $60,000. That level now carries added significance. A daily close back above $60,000 preserves the developing relative-strength index (RSI) bullish divergence across the one-hour, four-hour, and daily time frames which signals that selling momentum is fading even as the price prints lower lows.BTC/USDT, one-day chart. Source: Cointelegraph/TradingViewFutures trader Byzantine General shared a similar outlook, saying the move to $58,000 cleared out leveraged longs while drawing in fresh short sellers. In his view, a daily close above $60,000 would strengthen the case that Bitcoin has printed a local bottom for now. That would also shift attention toward a large pocket of upside liquidity. More than $4 billion in short liquidations cluster near $65,000, compared with about $1 billion below $55,000, creating a four-to-one imbalance. A relief rally could then target internal liquidity near $68,000, where a daily fair-value gap adds another area of interest for traders. BTC liquidation map. Source: CoinGlassMeanwhile, a daily close below $60,000 reinforces the bearish bias on both the short-term and long-term charts. The next area of interest then shifts to $55,000, where Bitcoin’s September 2024 weekly range low converges with its realized price near $54,000. The realized price, which tracks the average cost basis of all onchain coins, has historically provided support at every major Bitcoin bear-market bottom since 2014. That trend makes the $54,000-$55,000 region a key level for traders to watch if selling pressure continues. Bitcoin’s realized price. Source: XRelated: Bitcoin drop to $58K brings out bears: Is BTC’s next stop below $50K?

Čítaj viac
XRP risks drop below $1, but onchain data highlights silver lining

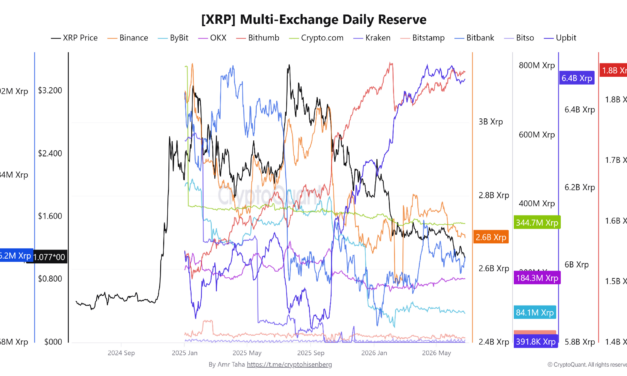
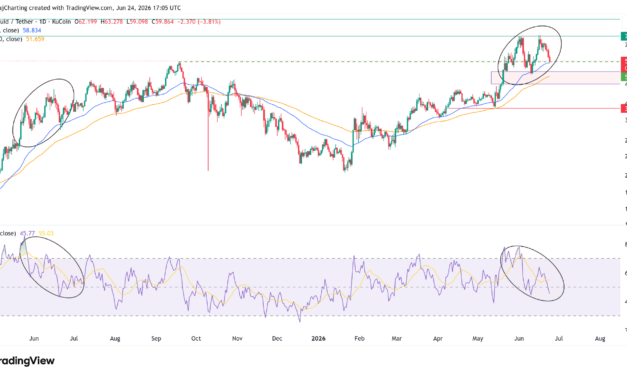
XRP is trading just above $1, leaving the token at its weakest price level of the year, but onchain data paints a different picture. The exchange-held XRP supply continues to fall, Binance withdrawals have exceeded deposits for seven straight days, whale flows are holding positive and spot XRP exchange-traded funds (ETFs) have attracted $243 million in inflows since April.The improving onchain data points to healthy network positioning, even as XRP continues to search for a price bottom.  XRP supply on exchanges continues to shrinkCrypto analyst Amr Taha noted that Binance’s XRP reserve has fallen to its lowest level since March after roughly 100 million XRP left the exchange over the past month. Binance’s balance stood at about 2.68 billion XRP on June 25, down from 2.78 billion XRP on May 12, accounting for the largest outflow among major trading platforms.XRP multi-exchange daily reserve. Source: CryptoQuantOther exchanges also posted smaller declines. Upbit’s reserve fell to 2.48 billion XRP on June 25 from 2.51 billion XRP on May 31, while Bybit’s holdings declined to 82 million XRP from 92 million XRP on June 2. Binance led in absolute outflows, while Bybit recorded the steepest percentage decline.Taha also highlighted a significant shift in Binance transaction activity. XRP withdrawal transactions have exceeded deposits for seven consecutive days since June 17. The seven-day withdrawal share climbed to 53.8% on June 23, its highest reading since June 2024, while deposits fell to 46.1%, the weakest level since 2024.XRP daily deposit/withdrawal transactions (%) on Binance. Source: CryptoQuantThe metric tracks transaction count rather than XRP volume. This indicates users are moving coins off Binance more frequently than sending them to the exchange, marking the longest withdrawal-led stretch in roughly a year.Large XRP holders supported the trend. XRP whale flow on the 90-day moving average has stayed positive throughout the quarter at 5.143 million XRP per day, showing consistent net accumulation by large wallets instead of distribution. XRP whale flows. Source: CryptoQuantInstitutional demand has also added support. Spot XRP ETFs recorded $2 million in net inflows on June 24, lifting June’s total netflows to $31 million. Since April, the total cumulative inflows have reached $243 million.Related: SBI to acquire Bitbank in $289M deal creating Japan’s biggest crypto exchangeXRP price approaches a major demand zoneFrom a technical standpoint, the higher-time-frame market structure remains bearish for the altcoin. XRP touched $1.01 on Thursday, its lowest price of 2026, leaving the token close to its first move below $1 since November 2024. The decline has pushed XRP down 43% year-to-date.XRP/USDT, one-week chart. Source: Cointelegraph/TradingViewThe next key area for XRP sits within the fair value gap between $1 and $0.63, an unfilled price gap created during the sharp rally in late 2024 that could attract buying interest if the decline extends in the coming weeks. Black Swan Capitalist founder Versan Aljarrah continues to focus on the longer-term chart. The analyst said XRP has spent years building a large accumulation range with higher lows on both weekly and monthly timeframes.XRP/USD, one-month chart analysis by Versan Aljarrah. Source: XAljarrah argued that extended consolidations often produce stronger breakout moves once the price eventually breaks out of the range, with the analyst targeting $10, i.e., a 900% increase from the current price. Related: HYPE down 22% from record highs: Will spot demand revive the uptrend?

Čítaj viac

HYPE down 22% from record highs: Will spot demand revive the uptrend?

Hyperliquid’s HYPE token is down 22% from its $75 all-time high, bringing its 2026 uptrend to a key test of support. Market participation has cooled across the derivatives markets, while the spot flows show early signs of stabilization after strong selling pressure in early June. The $50-$54 area now stands out as the most important support zone beneath current prices and the first major trend test since January. Spot selling begins to ease for HYPEHYPE fell below $60 on Wednesday after rejecting another retest of its all-time high near $76. The decline has pushed the price toward the 50-day exponential moving average, a level that has acted as trend support throughout the rally from March.The recent pullback resembles HYPE’s consolidation in May 2025. At that time, the token printed a new high near $40 before entering a multi-week pause that cooled momentum without producing a bearish break on the daily chart. HYPE price comparison, July 2026 and May 2025. Source: Cointelegraph/TradingViewThe relative strength index is following a similar setup, rolling over from overbought conditions while remaining above the levels typically associated with trend reversals.However, onchain data paints a cautious picture. Aggregated spot cumulative volume delta (CVD), which measures net buying and selling activity in spot markets, has improved from recent lows during the correction. The recovery has reduced the earlier sell imbalance, though spot CVD remains deeply negative at nearly $95 million.HYPE price, open interest, spot and futures CVD, funding rate. Source: VeloThe shift suggests selling pressure is easing rather than aggressive accumulation. Spot buyers have started absorbing supply near current levels, though the scale of demand remains modest compared to $110 million in selling recorded during HYPE’s decline from $76 in early June. The derivatives activity continues to weaken. Open interest has fallen to $1.73 billion from $2.2 billion, while derivatives CVD has continued trending lower and now sits near negative $389 million, down from $400 million at the beginning of June. Currently, HYPE traders appear to be reducing exposure rather than opening new positions.Related: Solana grabs 95% of tokenized equity as traders debate if SOL bottom is in$50 support comes into focusThe next major test lies between $50 and $54, where the rising 50-day exponential moving average aligns with an unfilled daily fair-value gap. The zone represents the first significant support cluster below the current prices.Holding above the region preserves HYPE’s sequence of higher highs and lows, which has remained intact since January. It also keeps the current pullback consistent with previous consolidations that developed within the broader uptrend.HYPE/USDT, one-day chart. Source: Cointelegraph/TradingViewA daily close below $53 would mark the first meaningful bearish shift on the daily chart this year. The 100-day EMA near $51.6 becomes the next support level, followed by the lower boundary of the fair value gap near $49. Below that, the next notable support area sits near $38.For now, the most important signal is the gap between improving spot flows and declining participation across leveraged markets. The strength of demand around the $50-$54 support zone may offer the clearest indication of whether HYPE’s correction is nearing exhaustion or preparing for a deeper retracement.Speaking in terms of accumulation, crypto trader Altcoin Sherpa said, “HYPE, I think anywhere in the 55-64 area is a pretty good place to accumulate this one. I think it goes to $100 later this year personally and is still the best altcoin…but it’s going to also depend a lot on bitcoin IMO.Related: Bitcoin crash to $60K opens new $530M demand zone: Will bulls buy in?

Čítaj viac

Bitcoin crash to $60K opens new $530M demand zone: Will bulls buy in?

Bitcoin (BTC) has fallen 3% over the past 24 hours, trading into a dense buy-side liquidity zone after slipping below $61,000. More than $525 million in buy bids initially stacked between $60,500 and $61,500 created a key area of demand as liquidation risk builds on both sides of the market.BTC’s orderbook data shows concentrated liquidity pockets below $60,500 and near $65,000, placing liquidity flows at the center of Bitcoin’s short-term price action.Bitcoin momentum weakens below $63,000Bitcoin closed at $62,700 on Tuesday, its lowest daily candle close since June 10. The move also produced a bearish engulfing candle against Monday’s range, erasing the prior day’s gains and signaling weaker short-term momentum.BTC/USDT, one-day chart. Source: Cointelegraph/TradingViewThe price has since consolidated beneath $63,000 after losing that level as support. The one-hour chart shows a series of lower highs following the rejection near $66,000 earlier this week. The momentum indicator, or relative strength index (RSI), has cooled from recent overbought levels, while Bitcoin continues to trade above the June range low near $60,500.BTC/USD, one-hour chart. Source: Cointelegraph/TradingViewCrypto trader Lennaert Snyder called for caution and expected BTC to test the lower liquidity before considering long exposure. The trader said, “Bitcoin started a little bounce, but I’m not convinced and not buying in yet,” Snyder wrote in a recent market update.The trader identified $61,500 and $60,500 as the primary levels to watch for bullish reactions. On the upside, he pointed to $63,500 and $64,000 as potential areas where liquidity could attract price before another move lower.Related: Multi-year Bitcoin holder selling falls to 19-month low as halving model flags new market bottom date$530 million in BTC buy bids sit below $61,000Data from Velo shows that BTC traders initially added 8,366 BTC to bid liquidity between $61,500 and $60,500. At the time of writing, Bitcoin has traded through a significant portion of that range, triggering roughly $270 million worth of buy orders as the price dipped below $61,000.The remaining bids remain near the lower end of the liquidity cluster, where traders are attempting to absorb the latest wave of selling pressure.BTC buy bids analysis. Source: Velo ChartThe move below $61,000 has already flushed a significant portion of the leveraged long positions clustered around $61,500. CoinGlass data shows more than $125 million in long liquidations over the past hour, reducing downside liquidation pressure near the current price.With much of the nearby long-side leverage cleared out, the liquidation map now shows a growing imbalance toward short positions positioned above spot price.Now, more than $1.2 billion in short positions sit near $63,500. A stabilization in the remaining bid liquidity around $60,500-$61,000 may shift attention toward those positions, especially as the downside liquidation pools become less concentrated following the latest flush.Bitcoin liquidation map. Source: CoinGlassThe next major concentration of liquidation risk sits near $65,000, where more than $2.4 billion in short positions are vulnerable. Such setups often trigger fast moves as liquidations fuel additional buying. For now, the largest liquidity concentrations remain near $60,500, where both spot demand and leveraged exposure remain heavily stacked.Related: BTC price four-year trend calls for $76K as analysis says Bitcoin ‘not broken’

Čítaj viac

Multi-year Bitcoin holder selling falls to 19-month low as halving model flags new market bottom date

Bitcoin (BTC) holders who acquired their coins more than five years ago have cut spending to a 90-day average of 962 BTC, the lowest level since November 2024, according to CryptoQuant data. The slowdown follows three major spending peaks over the past two years, including a high of 3,860 BTC in May 2024. At the same time, BTC analysts said that market and profitability indicators are converging in the second half of 2026, putting a new timeline of a potential Bitcoin bottom. Bitcoin “OG” holders step backCrypto analyst Darkfost said the current cycle has produced the highest level of spending by long-term Bitcoin holders on record. The cohort tracked in the dataset consists of investors who acquired Bitcoin more than five years ago. Using spent transaction outputs (STXO), which track Bitcoin that has moved across the network, the analyst identified three major spending waves following strong rallies.OG Bitcoin Holders selling pressure. Source: CryptoQuantThe 90-day moving average peaked at 3,860 BTC in May 2024, 3,200 BTC in February 2025 and 2,360 BTC in September 2025. Individual sessions were far larger, with some days recording output exceeding 10,000, 30,000 and even 142,000 BTC.That selling pressure has eased sharply. The 90-day average has dropped to 962 BTC, the lowest reading in 19 months. Darkfost said the most expensive coins held by this group were acquired for about $63,200, which is close to current prices. This indicates that many of these holders are choosing not to sell, even though their holdings are trading near their highest cost basis.Bitcoin Researcher Axel Adler Jr. further noted a split between newer and older BTC investors. The analyst said that Bitcoin’s adjusted net unrealized profit/loss (aNUPL) has fallen to -0.14 from near zero a month ago, showing that the average holder has moved back into unrealized losses as BTC traded near $62,500. However, Adler Jr argued, “STH capital has shrunk by -56%, while LTH capital has barely drawn down. Weak hands are capitulating. Strong hands have not even flinched.” Adler Jr. added that the key metric has spent nearly half of the past three months below zero, indicating sustained pressure on newer BTC market participants rather than a broad capitulation across long-term holders. STH vs LTH realized cap analysis. Source: Axel Adler Jr.Related: Bitcoin slump worsens amid SpaceX rout: Can BTC price hold $60K any longer?BTC halving cycle points to September bottom, says analystCrypto analyst LP highlighted a recurring pattern tied to Bitcoin’s halving cycles. The previous bear market entered a final capitulation phase 826 days after the halving event, followed by a major low and sideways consolidation for 70 to 110 days.For the current cycle, the 826-day marker falls on July 6. Applying the same timing range places a potential bottoming window in early September.BTC bottom analysis by LP. Source: XThe trader noted that the scenario becomes more relevant if Bitcoin continues to trade higher into early July. Likewise, BTC trader Titan also identified downside liquidity below the current levels. On the quarterly chart, Bitcoin has an untapped low near $58,900 and an open fair value gap between roughly $49,000 and $58,900. The trader explained that leaving the quarterly low untouched throughout September may draw more attention to that liquidity zone, eventually leading to a market bottom between Q3 and Q4. BTC quarterly analysis. Source: XRelated: Bitcoin gets new $54K warning as BTC price hits 11-day low on Asia tech sell-off

Čítaj viac

Získaj BONUS 8 € v Bitcoinoch

nakup bitcoin z karty

Registrácia Binance

Burza Binance

Aktuálne kurzy

